New book: Microsoft SQL Server 2008 Analysis Services Step by Step
While there may be a shortage of cash, jobs, and common sense in the world right now, there’s certainly no shortage of information. In fact, the already overwhelming amount of data is expected to grow another 35% each and every year. And yet information is critical to making intelligent decisions.
That’s where the field of business intelligence comes in. As Scott Cameron writes in his new book Microsoft SQL Server 2008 Analysis Services Step by Step, “Business intelligence should help you make better decisions faster.” And that’s just what Scott and his colleagues at Hitachi Consulting show you in the book, whether you’re a BI developer, administrator, or business manager.
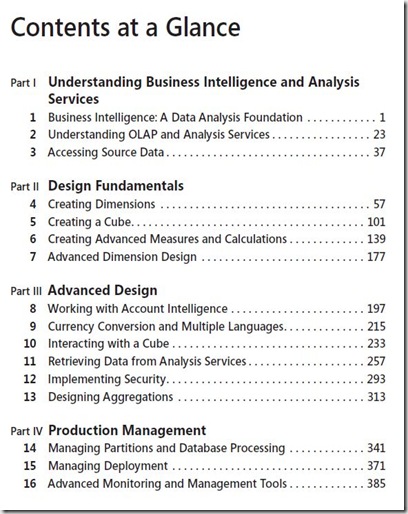
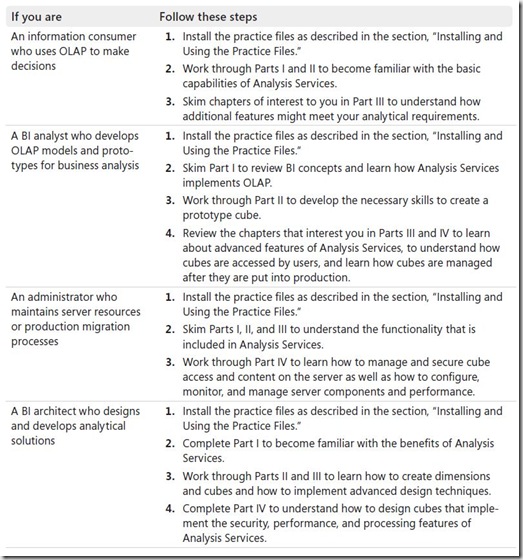
In honor of Microsoft’s TechEd 2009 conference, wrapping up tomorrow in Los Angeles, we’d like to give you a more generous than usual sampling from the book. The samples includes the Contents at a Glance page, a table mapping out the book for each segment of the target readership, and an overview of business intelligence explaining how and where Analysis Services fits into the bigger picture.
Note: If you’re a BI developer and would like more detailed information and instruction on MDX, the language used by Analysis Services for data access, we’d like to recommend Microsoft SQL Server 2008 MDX Step by Step by Bryan C. Smith and C. Ryan Clay (the subject of a previous post).
Introduction
Microsoft SQL Server 2008 Analysis Services is the multidimensional online analytical processing
(OLAP) component of Microsoft SQL Server 2008 that integrates relational and OLAP
data for business intelligence (BI) analytical solutions. The goal of this book is to show you
how to use the tools and features of Analysis Services so you can easily create, manage, and
share OLAP cubes within your organization. Step-by-step exercises are included to prepare
you for developing your own BI solutions.
To help you learn the many features of Analysis Services, this book is organized into four
parts. Part I, “Understanding Business Intelligence and Analysis Services,” introduces BI,
multidimensional analysis, and OLAP and explains how Analysis Services implements the
benefits of OLAP. Part II, “Design Fundamentals,” teaches you how to design data sources,
data source views, dimensions, and cubes. Part III, “Advanced Design,” shows you how to use
Multidimensional Expressions (MDX) and aggregate functions to perform complex calculations
and summarizations, and to create key performance indicators (KPIs). In addition, this
part covers special Analysis Services features for advanced dimension design, financial analysis,
globalization, and a variety of interactions that extend the analytical capabilities of cubes.
You will also learn how to create analytical reports using Microsoft Office Excel and SQL
Server 2008 Reporting Services. Part IV, “Production Management,” explains how to use security
to control access to cubes and to restrict the data that a particular user can see, how to
design partitions to manage database scalability, and how to manage and monitor Analysis
Services databases.
Finding Your Best Starting Point in This Book
This book covers the full life cycle of an Analysis Services solution from development to deployment.
If you’re responsible only for certain activities, you can choose to read the chapters
that apply to your situation and skip the remaining chapters. Use the following table to
find your best starting point.
Introducing Business Intelligence
Business intelligence (BI) is information that has been derived from the data contained in
your organization’s operational systems or external sources. Business intelligence should help
you make better decisions faster. Suppose you are the president of a small, new company,
Adventure Works Cycles, that manufactures and sells bicycles, bicycle components, clothing,
and accessories for North American, European, and Asian markets. Adventure Works needs
to grow, but has limited resources to support expansion. You have decisions to make, and to
make those decisions you must have particular information. You keep up with general business
trends by reading the Wall Street Journal, and you keep a bookmark in your browser
pointed at www.bloomberg.com. This information, along with your experience, enables you
to make subjective, “gut-feeling” decisions. But you want to start making objective, by-the-numbers
decisions. The numbers you need are in your company’s order-processing, accounting,
human resources, and other business systems. You also need to get third-party-provided
market forecasts and exchange rates. You need a tool that will bring together all of this information
and put it at your fingertips. That tool is a BI system. A BI system is the solution for
gathering data from multiple sources, transforming that data so that it is consistent and stored
in a single location, and presenting the information to you for analysis and decision making.
A BI system can have up to five layers:
1. A data source layer
2. A data transformation layer
3. A data storage and retrieval layer
4. An analytical layer
5. A presentation layer
The data source layer is composed of the data in the systems your organization uses to
conduct its day-to-day operations; data in text files, Microsoft Office Excel spreadsheets, or
Microsoft Office Access databases; and data you acquire from external sources. Because this
data is in many different sources, it is extremely difficult to use it to create reports and perform
analysis. The data transformation layer is used to extract the data from the multiple sources,
modify the data so that it is internally consistent, and load it into a data storage system.
The data storage and retrieval layer is a data warehouse that has been created in a relational
database management system. The data warehouse is the system of record. It contains authoritative
numbers for your organization. A mature enterprise data warehouse contains data
related to all aspects of your organization. Your data warehouse is a busy and complex place.
Data loads occur monthly, weekly, daily, or even more frequently. Reports and analytical queries
run day and night. To reduce the burden on the data warehouse and to simplify user access,
data about individual subject areas is extracted from your data warehouse, summarized,
and loaded into data marts. The data marts can be relational databases or they can be multidimensional
OLAP (online analytical processing) databases. Analysis Services is one example
of a multidimensional OLAP database.
The purpose of the analytical layer of your BI system is to turn data into information and
to provide quick and easy access to that information for decision makers. Multidimensional
OLAP databases form the analytical layer of your BI system. When detailed data from the
data warehouse is loaded into a multidimensional OLAP database, summarized values are
precalculated. Because summary values are stored in the database, reports and analytical
queries execute quickly. When data is loaded into a multidimensional OLAP database,
metadata is added to the data. Metadata is data about the data. The metadata in an OLAP
database includes information about relationships and hierarchies in the data, how the data
should be sorted and summarized, and how it should be formatted for presentation. The
metadata in the OLAP database is what turns data into information. Complex calculations
can be created and then stored in the OLAP database. This makes information access easier,
because report and query writers don’t have to repeatedly create calculations, and everyone
in your organization will be able to use the exact same calculation formulas.
Reporting and visualization tools form the presentation layer of your BI system. Applications
in the presentation layer of your BI system can query your data warehouse, data marts, or
multidimensional OLAP databases and present it in a variety of formats. Your BI system can
send reports to your outside sales force and delivery workers’ mobile phones to direct their
daily activities. Analytic workflow diagrams illustrate complex business processes and at each
node show the information decision makers need to make high-valued choices. Interactive
analytical reports with slice-and-dice, pivot, and drilldown capabilities and multidimensional
data visualizations help managers and analysts troubleshoot issues and find information to
help your organization operate more efficiently and take advantage of new opportunities.
Dashboard reports with key performance indicators enable executives to quickly determine
whether the organization is meeting its strategic objectives.
You shouldn’t be dogmatic about what constitutes your BI system. A BI system can have all
the layers mentioned earlier or only a few. For example, if you’re using Analysis Services in a
near-real-time monitoring system, you can load data directly from a manufacturing systems-control
database into your multidimensional OLAP database every few minutes. The presentation
layer of your BI system then reads data from Analysis Services and displays a diagram
showing each machine on the production line and how well it is currently performing compared
to its long-term average. This BI system has no data warehouse and the data transformation
and analytical layers are combined. The complexity of your BI system isn’t important.
What is important is that your BI system provides information that is relevant to the decisions
you need to make, understandable and persuasive, reliable, quick and easy to access and manipulate,
and available when you need it.


