New book: Create Dynamic Charts in Microsoft Office Excel 2007 and Beyond
I’m nuts about Excel and not ashamed to admit it. Some days I have to make myself stop analyzing sales data and actually produce marketing materials. My skills in Excel have grown over the years—I’m comfortable with pivot tables—but my skills in charts and graphs leave much to be desired. I have seen many effective charts while working at Microsoft and have envied the folks who can put them together. The book I’ve been waiting for has finally arrived: Create Dynamic Charts in Microsoft Office Excel 2007 and Beyond , by Reinhold Scheck(Microsoft Press, 2008; ISBN: 978-0-7356-2544-0).
I can’t wait to start producing charts that look like this: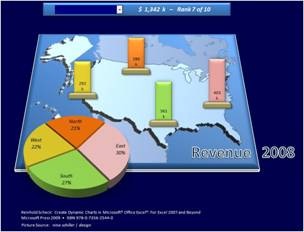
What I like most about this book so far is that it’s not just about creating pretty charts and graphs. It’s about how to choose the right kind of graph to display data and how to go about charting very complicated data. I can’t imagine anyone in a marketing or sales role today who isn’t charged with communicating data to other people in the organization. I know that this book will be used at my desk frequently.