Troubleshoot PnP device issue through Debug Trace from PnP Manager
The PnP Manager is a key component of the Windows Kernel.
There had been lots of PnP device related issues in the real world. Here we
introduce some basic Debug Traces from the PnP Manager to help narrow down a
PnP device issue. These traces required to be enabled before the PnP issue is
reproduced, then we can capture the trace when the PnP issue happens. Finally,
we will stop the trace and check the trace file.
1. The ETW trace from PnP
Manager
The ETW trace is the easiest method to capture because it
had been available in the released build of OS.
For example, I enabled the ETW trace by following command
(this command requires the cmd.exe to be launched by Run as administrator):
logman create trace
"kernel_pnp_trace" -ow -o c:\kernel_pnp_trace.etl -p
"Microsoft-Windows-Kernel-PnP" 0xffffffffffffffff 0xff -nb 16 16 -bs
1024 -mode Circular -f bincirc -max 4096 -ets
This command will create a new ETW trace session and enable
the provider: Microsoft-Windows-Kernel-PnP which is provided by the Windows
kernel.
Then I attach a USB mouse. And then I stop the trace
session:
logman stop
"kernel_pnp_trace" -ets
Finally, I got an etl file which had recorded the activities
in Windows kernel PnP manger. The etl file is a binary file which need to be
converted to a human readable file. For example, we can covert the etl file to
an XML file:
tracerpt
c:\kernel_pnp_trace.etl -o kernel_pnp_trace.xml -of xml
You can format the display of the xml file by any tools. For
example, following is the original record of the enumeration of a mouse device:
<Event xmlns="https://schemas.microsoft.com/win/2004/08/events/event"> <System> <Provider Name="Microsoft-Windows-Kernel-PnP" Guid="{9c205a39-1250-487d-abd7-e831c6290539}" /> <EventID>801</EventID> <Version>0</Version> <Level>4</Level> <Task>800</Task> <Opcode>0</Opcode> <Keywords>0x1000000000800000</Keywords> <TimeCreated SystemTime="2015-06-29T21:35:07.829150300Z" /> <Correlation ActivityID="{00000000-0000-0000-0000-000000000000}" /> <Execution ProcessID="4" ThreadID="8000" ProcessorID="2" KernelTime="2970" UserTime="0" /> <Channel>Microsoft-Windows-Kernel-PnP/Analytic</Channel> <Computer /> </System> <EventData> <Data Name="DeviceNode">0xFFFFE00082117230</Data> <Data Name="DeviceInstancePath">USB\VID_045E&PID_0745\6&5ea12e&0&2</Data> </EventData> <RenderingInfo Culture="en-US"> <Level>Information </Level> <Opcode>Info </Opcode> <Keywords> <Keyword>Enumeration</Keyword> </Keywords> <Task>ProcessNewDevice</Task> <Channel>Pnp Analytic Channel </Channel> <Provider>Microsoft-Windows-Kernel-PnP </Provider> </RenderingInfo> </Event> |
There are lots of Events recorded in the trace file. Based
on the trace file, we may find out what had happened in the PnP Manager.
2. The Debug Message from the
checked build of PnP Manager
The checked build of PnP
Manager has detailed trace which can be enabled if we can reproduce a PnP issue
with the checked build or checked kernel. Basically, we get the checked (debug)
build of the OS kernel from:
u WDK
Installation: C:\Program Files (x86)\Windows Kits\8.1\Debug\winv6.3
u A
checked build of OS from MSDN Subscription
Then we can copy the
checked kernel to a release build of OS. We need to know which kernel and hal
files currently are used so that the correct files from the checked build are
used. See the https://msdn.microsoft.com/EN-US/library/windows/hardware/ff547188(v=vs.85).aspx
for details.
Then we can Create a new Boot Entry with the checked kernel
files
bcdedit
/copy {current} /d "Windows 8.1 Checked Build kernel"
bcdedit
/set GUID kernel ntkrnlmp.chk
bcdedit
/set GUID hal halmacpi.chk
Note that the ntkrnlmp.chk and halmacpi.chk are from the
checked build or WDK. Please rename these checked build files so that no
existing files in the %SystemRoot%\system32 are overwritten.
After the checked build of PnP Manager is available, we can
enable the output from PnP Manager by:
u Enable
NTOSPNP flag in the HKEY_LOCAL_MACHINE\SYSTEM\CurrentControlSet\Control\Session
Manager\Debug Print Filter
NTOSPNP
(REG_DWORD) = 0xFFFFFFFF
After above change, you should be able to see the debug
messages from a kernel debugger or dbgview.
For example:
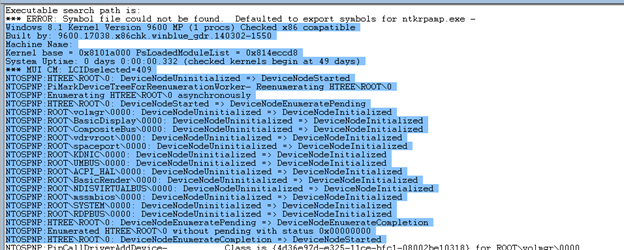
The information from the checked build has lots of detailed
information which will be helpful for the driver developer.
Thanks,
Jungang Bai