Why function callees sum up with more than 100% in Caller/Callee view?
We are asked this question sometimes, especially when customers profile real world UI applications. Since it may be really confusing, I’ve decided to post the explanation of this “phenomena”.
The Caller/Callee is one of views that are generated by Microsoft Visual Studio Team System 2005 during application profiling. The view is described in details in “Analyzing a performance report in Visual Studio Team System 2005 Part 2: The Function, Caller / Callee and Calltree views” posting or in “Make Your Apps Fly with the New Enterprise Performance Tool” MSDN article.
Why do we see callees that sum up with more than 100% of Inclusive Percent samples?
That I can tell you in one word – recursion.
Let’s try to analyze the following simple code.
void A(bool);
void B();
void C();
void main()
{
A(true);
}
void A(bool CallB)
{
if(CallB)
B();
else
C();
}
void B()
{
A(false);
}
void C()
{
while(true)
;
}
Actually, this code doesn’t have a pure recursion – no function calls itself. As you can see, the program will block itself having the following call stack:
main à A à B à A à C
So, function A appears more than once on the stack. Let me refer to this as some sort of recursion. The interesting point here is that function A calls different functions each time (first time it calls B, and second time it calls C)
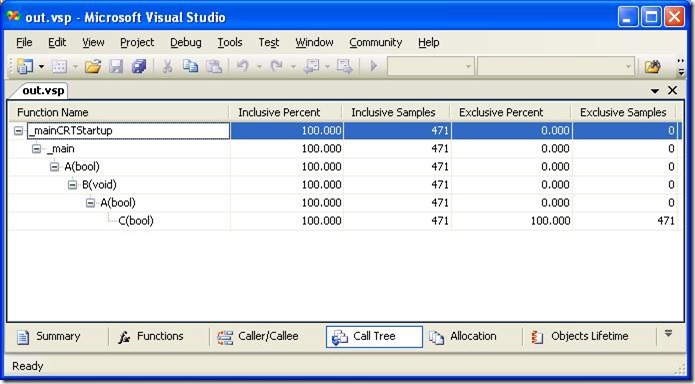
Sample profiling of this application gives us the expected Call Tree view:
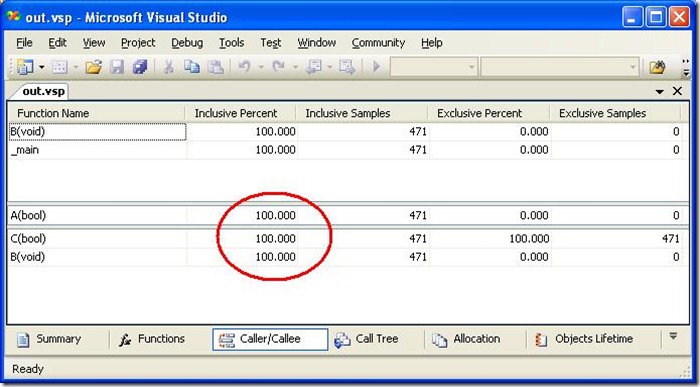
We also get the following Caller/Callee view (showing functions called by A and functions calling A):
We see that B and main are callers of A, while B and C are also callees (called by A).
But why both C and B in the bottom panel have 100% Inclusive Percent of samples? First, they are "children" of A, so they cannot both have more than A has. Second, 100% + 100% = 200%. It doesn’t make any sense!
Well, apparently it does. Let’s try to analyze the data we got.
A calls B, and A calls C. Therefore, both B and C are in the bottom panel of Caller/Callee view as callees of function A.
A, B and C – they are on stack. The only function that has exclusive samples is C, which is at the bottom of the stack (see “What are Exclusive and Inclusive?!” post explaining a difference between Inclusive and Exclusive samples) . Therefore, A, B and C all have 100% of Inclusive Percent.
Functions B and C sum up in inclusive samples with more than function A, and they also sum up in Inclusive Percent with more than 100%. Yet it is still true.
The above scenario is artificial. Real life scenarios, however, may have some variation of the recursion pattern that we discussed, thus generating profiling data that may confuse at the beginning. I hope this explanation makes it clearer.

