Show me! Explain it with an example
When I first started documenting canvas APIs (way back in IE9), I needed to create examples for myself to understand how they worked. This is a pretty common practice when documenting code. In most cases, the examples made it into the topics to illustrate how to use the API.
Recently, I've gone back and put those examples onto our sample server to eliminate the need to copy and paste code to see the API in action. I came across three samples that took a step just a little farther than just figuring out how the API was called. These examples actually showed some key issues, and really helped my own understanding. Additionally, the output from two of them were used as screen shots to illustrate the concepts.
lineCap property
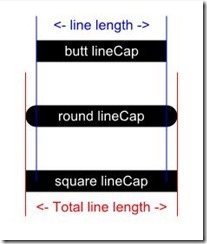
The first example was the lineCap property which specifies how to terminate a line. You can assign one of three string values; butt, round, and square. The butt value tells canvas to not put any cap on the end of a line. The round value tells it to put on a round end, and square makes a square end. Round and square both extend the line approximately 1/2 the line width, for each cap.
That little bit of extra space could cause some problems, as the caps add to the specified line length. This is an issue if you're trying to accurately place your lines. I explained that concept with words in the topic, but realized a picture tells a better story. To do that, I created an example showing the concept. I added some vertical lines to show what the exact lengths of the lines, and how much the caps add.
arcTo method
The next example is the arcTo method.
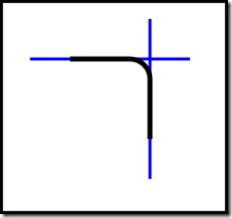
The arcTo method draws an arc between two imaginary tangents, as the W3C spec describes it. This description required me to dig back into what I should have remembered from my high school geometry class (I didn't really pay attention).
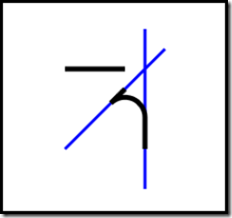
For the example I drew two arcs. One made a nice rounded corner between two straight lines. The other didn’t complete the rounded corner because the tangents were closer together. I drew both the straight lines (in black), and the imaginary lines (in blue) to show the relationship. Maybe for you it would be obvious, but at the time it helped me understand how all the parameters worked together.
miterLimit property
Lastly, the miterLimit property. This property is a ratio of the angle when two lines come together. The ratio describes whether the desired effect of the lineJoin miter happens property. LineJoin specifies how canvas draws the intersection when two lines come together (say on a triangle). LineJoin’s options are bevel, round, and miter. When using a bevel or round lineJoin, the miterLimit setting has no effect.
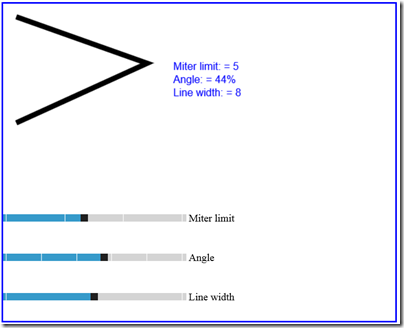
However when you set lineJoin to miter (which brings the two lines to a point), miterLimit controls whether canvas draws a point or a squared edge corner. If the calculated ratio ((lineWidth / 2 ) / miter length) is below the miterLimit, you get a squared off edge.
Experimenting with different hardcoded lineWidths and miterLimits didn't show the difference very well. Taking one of the examples, I substituted HTML5 slider controls so I could independently control the line width, angle of the two lines, and the miterLimit. If you're using IE9 then you'll see text boxes instead of sliders. Sorry, it's worth the upgrade to a later version of IE.
Viola! I was able to get the point to disappear and reappear, based on the values I slid into place.
Here’s the final example:
See the code
There are lots of samples that show how to use an API in the reference content. However these are among my favorites as they show how to write the syntax, and illustrate some of the concepts of the API.
For the code behind these examples, check out:
Let me know what you think!


