Microcode: Debugging Cmdlets and Providers with Visual Studio and CTP2
In PowerShell CTP2, you have a nice cmdlet, Add-Module, that frees you from the constraints of having to declare a snapin. By using Add-Module, you can take any old library of code and load it to find cmdlets or providers. This means that debugging your cmdlets and providers in Visual Studio is a real snap.
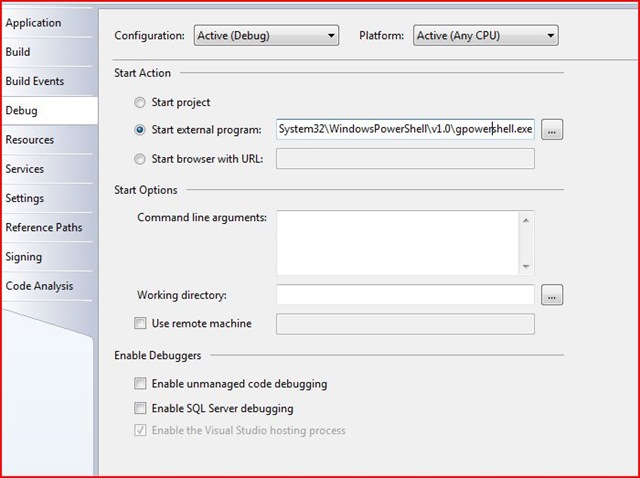
To debug a cmdlet or provider using Windows Powershell CTP2, right click the project file containing your cmdlet, then click properties, then Debug. Change it to Start External Program and put either C:\Windows\System32\WindowsPowerShell\v1.0\gpowershell.exe (Graphical PowerShell) or C:\Windows\System32\WindowsPowerShell\v1.0\powershell.exe (Console PowerShell)
You can also simply edit the .csproj.user file in the same directory. This file stores user settings for debugging a Visual Studio project. Here's mine:
<Project xmlns="https://schemas.microsoft.com/developer/msbuild/2003">
<PropertyGroup Condition=" '$(Configuration)|$(Platform)' == 'Debug|AnyCPU' ">
<StartAction>Program</StartAction>
<StartProgram>C:\Windows\System32\WindowsPowerShell\v1.0\gpowershell.exe</StartProgram>
<StartArguments>
</StartArguments>
<StartWorkingDirectory>
</StartWorkingDirectory>
</PropertyGroup>
</Project>
Once you debug, you'll be in the same directory as all of the compiled DLLs. Simply run the following command (replace cmdlet.dll with your own cmdlet) and you'll be able to debug your cmldet or provider.
Add-Module Cmdlet.Dll
Add-Module is something that's only part of Windows PowerShell CTP2, but the debugging tricks will also work with a cmdlet installed with InstallUtil.
Hope this helps,
James Brundage [MSFT]