Adding Trace to Azure Web Sites and Web Jobs
Using standard .NET trace in Azure Web Sites and Web Jobs is an extremely simple affair, with trace output being directed to either table, blob or file storage without the need for any configuration file or code changes. This is great and a very welcome simplification compared to what you had with web and worker roles. However, if you prefer to use the enhanced tracing features offered by the TraceSource class, then a little extra work is necessary. In this post we'll look at how to achieve this.
Enabling Trace in Azure Web Sites and Web Jobs
Let's quickly recap how to create trace statements and enable output in your web site or web job.
In your application you add relevant trace statements at strategic points, using an appropriate severity. This is achieved using the static methods on the Trace class as follows:
 System.Diagnostics.Trace.TraceError("TraceError WebSite");
System.Diagnostics.Trace.TraceInformation("TraceInformation WebSite");
System.Diagnostics.Trace.TraceWarning("TraceWarning WebSite");
Once your application is deployed to Azure, you can enable output from the portal by going to the configure tab for the web site. The settings will apply to all web jobs running under that web site:
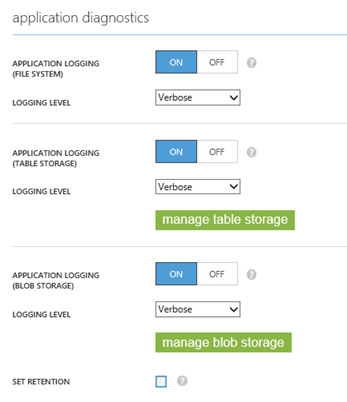
With the above settings, anything of verbose severity upwards will be logged to the file system and to Azure storage (table and blob). Clicking on the "manage …" buttons allow you to configure which table or blob container the output is written to. You really can't get simpler than that!
(Note: At the time of writing the new Azure portal currently allows you to only manage file system application logging. Managing application logging settings for table and blob is currently on the backlog and will be available in the near future. Alternatively you can use the REST API to apply these settings).
Here's what the trace output looks like in table storage:

Using the static Trace methods to generate such trace is fine for some applications but it has its limitations. For example, as shown in the above example you cannot specify an event id. Using these methods also prevent having finer grain control over what is output. For this reason, the TraceSource class was introduced to provide enhanced tracing features that can be used in place of the static Trace methods.
Using TraceSource in Web Sites and Web Jobs
When instrumenting an application it is sometimes desirable to provide tracing at different layers in the application architecture or for different components. For example, you may wish to have tracing specific to messaging, database access or business logic. Using TraceSource you can assign different TraceSource instances to those aspects of the application, and through configuration, control the behaviour of each TraceSource instance. I won't go into further details here but you can refer to the MSDN documentation for further reading.
In this example, I've chosen to add three categories of events to my web site for which I will add three different TraceSource instances:
 public static readonly TraceSource Operational = new TraceSource("Operational");
public static readonly TraceSource Messaging = new TraceSource("Messaging");
public static readonly TraceSource Diagnostics = new TraceSource("Diagnostics");
Now I can generate events for each of the instances as required:
 Operational.TraceEvent(TraceEventType.Warning, 101, "TraceEvent WebSite Operational");
Messaging.TraceEvent(TraceEventType.Information, 102, "TraceEvent WebSite Messaging");
Diagnostics.TraceEvent(TraceEventType.Verbose, 103, "TraceEvent WebSite Diagnostics");
One of the benefits of using a TraceSource is that you can assign an id to each event, to uniquely identify it in the output - crucial from an operations management perspective if you need to identify that a specific event has occurred.
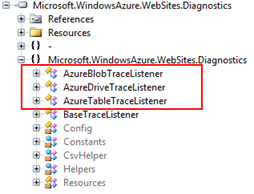
In order to get TraceSource to work with Web Sites and Web Jobs, you need to be aware of three listener types that can be found in the Microsoft.WindowsAzure.WebSites.Diagnostics DLL. Currently these types are undocumented since the design goal has been to minimise configuration and typically you should not need to know about their existence. However, if you want to go off-piste and use TraceSource then you'll need to familiarize yourself with them because in your configuration you will have to reference the listener type in order to write events to the appropriate output:
In the Web.Config of your Web Site (or the App.Config of your Web Job), add the following configuration:
 <system.diagnostics>

    <sharedListeners>
      <add name="AzureTableTraceListener" type="Microsoft.WindowsAzure.WebSites.Diagnostics.AzureTableTraceListener, Microsoft.WindowsAzure.WebSites.Diagnostics, Version=1.0.0.0, Culture=neutral, PublicKeyToken=31bf3856ad364e35" />
      <add name="AzureBlobTraceListener" type="Microsoft.WindowsAzure.WebSites.Diagnostics.AzureBlobTraceListener, Microsoft.WindowsAzure.WebSites.Diagnostics, Version=1.0.0.0, Culture=neutral, PublicKeyToken=31bf3856ad364e35" />
      <add name="AzureDriveTraceListener" type="Microsoft.WindowsAzure.WebSites.Diagnostics.AzureDriveTraceListener, Microsoft.WindowsAzure.WebSites.Diagnostics, Version=1.0.0.0, Culture=neutral, PublicKeyToken=31bf3856ad364e35" />
    </sharedListeners>

    <sources>
      <source name="Diagnostics" switchName="DiagnosticsSourceSwitch" switchType="System.Diagnostics.SourceSwitch">
        <listeners>
          <add name="AzureDriveTraceListener"/>
        </listeners>
      </source>
      <source name="Messaging" switchName="MessagingSourceSwitch" switchType="System.Diagnostics.SourceSwitch">
        <listeners>
          <add name="AzureTableTraceListener"/>
          <add name="AzureBlobTraceListener"/>
        </listeners>
      </source>
      <source name="Operational" switchName="OperationalSourceSwitch" switchType="System.Diagnostics.SourceSwitch">
        <listeners>
          <add name="AzureTableTraceListener"/>
          <add name="AzureBlobTraceListener"/>
        </listeners>
      </source>
    </sources>

    <switches>
      <add name="DiagnosticsSourceSwitch" value="All" />
      <add name="MessagingSourceSwitch" value="All" />
      <add name="OperationalSourceSwitch" value="All" />
    </switches>

    <trace autoflush="true" indentsize="4" />

</system.diagnostics>
Here we have defined three trace listeners, one for each of the Azure trace listener types. We've then defined three trace sources and assigned a listener to each of them. For the Diagnostics trace source, we will log to the file system and for Messaging and Operational trace sources we will write to table and blob storage. Here's what the output looks like:
AzureTableTraceListener output

AzureBlobTraceListener output (csv file)
date,level,applicationName,instanceId,eventTickCount,eventId,pid,tid,message,activityId
2014-09-04T11:09:13,Warning,logging,09482d,635454257537318640,101,12792,52,TraceEvent WebSite Operational,
2014-09-04T11:09:14,Information,logging,09482d,635454257543880608,102,12792,52,TraceEvent WebSite Messaging,
AzureDriveTraceListener output
2014-09-04T11:09:14 PID[12792] Verbose TraceEvent WebSite Diagnostics
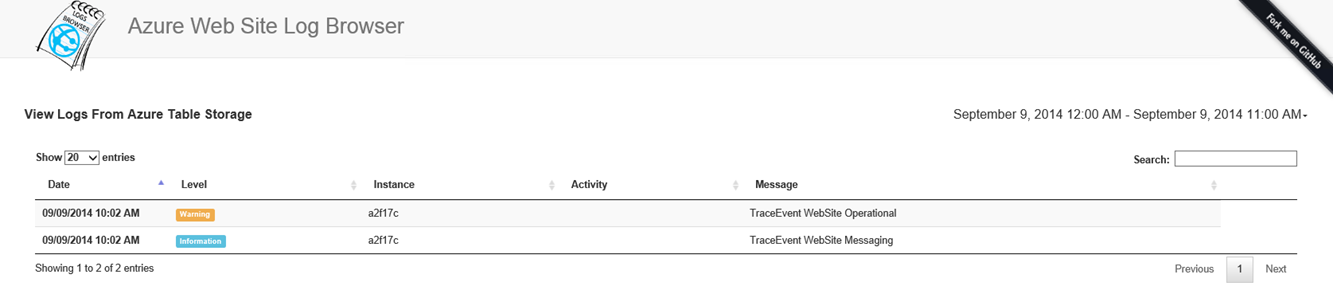
Using the Azure Web Site Logs Browser Site Extension
Site extensions are a great way of easily extending the functionality of your site through freely downloadable packages available from the site extensions gallery. One such site extension is the Azure Web Site Logs Browser which allows you to view your system and application logs (file, table and blob) through your web browser. Here's what the table storage content looks like:
So there you have it. Tracing in Web Site and Web Job applications using the standard .NET trace libraries is no different to any other .NET application. The key thing you need to know is what listener types you have available to you.
Happy tracing.
Written by Christopher Owczarek
Thanks to David Ebbo, Robert Jarratt and Amit Apple for their help in producing this post.