SQL Server Code-Named “Denali” - T-SQL Debugger Enhancements in CTP1
The debugger feature in SQL Server Management Studio gives us tools to debug T-SQL scripts, stored procedures, functions and triggers. In this article, I am going to discuss some of the newly added functionalities in T-SQL debugger in SQL 11 CTP1. These enhancements are mainly aimed at bridging the gap between T-SQL and C# debugging experience with features like Conditional Breakpoint, T-SQL expression evaluation in Watch & Immediate Window and DataTips. If you are experienced with the Visual Studio debugger features, you would find these techniques familiar.
Conditional Breakpoint
As the name suggests, Conditional Breakpoint functionality allows you to associate conditions with breakpoints. The debugger breaks on the conditional breakpoint only when the associated condition goes true in the execution cycle. Conditional Breakpoints are typically useful while debugging loops and when one wants to break inside the loop only when certain condition goes true or some variable value changes.
Let me explain the steps to create and use Conditional Breakpoint -
Assume that you have the following code in your T-SQL script:
USE [AdventureWorks]
GO
DECLARE @return_value INT
DECLARE @manager_id INT
SET @manager_id = 1
WHILE (@manager_id < 100)
BEGIN
EXEC @return_value = [dbo].[uspGetManagerEmployees]
@ManagerID = @manager_id
SELECT 'Return Value' = @return_value
SET @manager_id = @manager_id + 1
END
GO
Here we are executing a stored procedure in a loop with different parameter being passed to the stored procedure each time. By analyzing the results of execution, we have found out that we are getting unexpected results when @manager_id = 55. So we want to debug the stored procedure when “manager_id = 55” is being passed as the parameter. To do this, first put a breakpoint on the exec statement. On starting the debugger, execution will stop every time on that exec statement.
Now if we want the code to break only when @manage_id= 55, we need to associate a condition like “if (@manager_id == 55)” with the Breakpoint. Following are the steps to do this -
1. "Right Click” on the Red Breakpoint icon and go to “Condition”
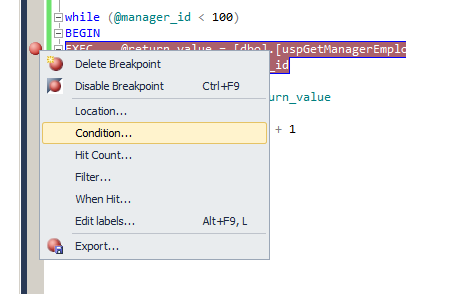
Figure: Right Click Breakpoint -> Condition…
2. Set Condition in the following dialog
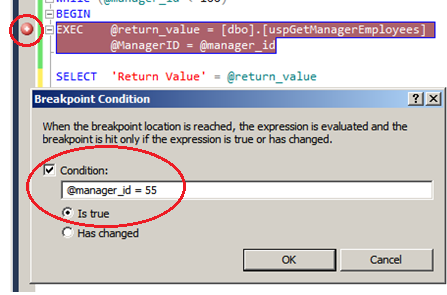
Figure: Breakpoint Condition Settings
Note: Check the Breakpoint Symbol. It should look like a plus (+) symbol inside the breakpoint circle which indicates conditional breakpoints.
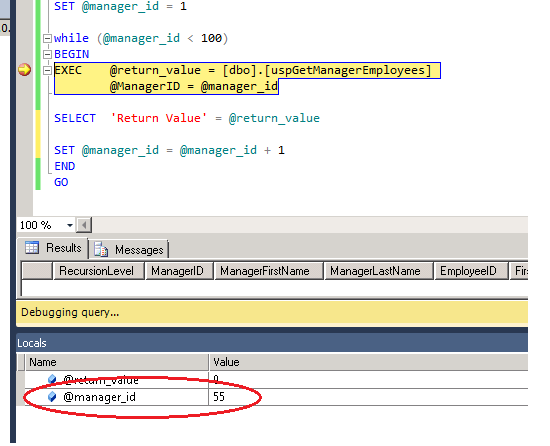
After setup of the conditional breakpoint, if you run the script to debug it, you will see that the execution of script is only paused when the given condition with breakpoint is satisfied (in this case when @manager_id = 55).
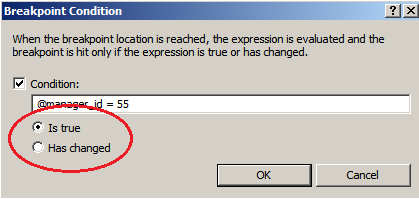
Additionally, there are two options for the condition that you can set:
1. "Is true" is used for T-SQL expressions that evaluate to true or false. If you select “Is True” kind of Condition, then the expression specified in Condition Text box should be a valid Boolean T-SQL expression
2. "Has changed" means if the expression specified in the condition box changes, then the execution stops. If you select “Has Changed”, then the expression needs to be a valid T-SQL expression that evaluates to a single data value
Expression Evaluation in Watch Window
The Watch Window, Quick Watch, and Immediate Window can now evaluate any T-SQL expression that results in a single data value. You can do arithmetic operations on variables, execute SQL sub-queries, watch a particular grid of a table and so on in the Watch/Immediate Window.
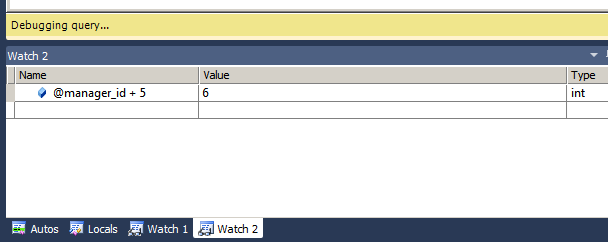
Figure: Arithmetic Operations on variables in Watch Window
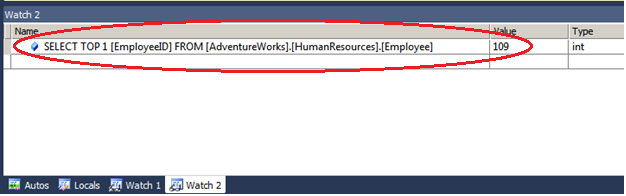
Figure: Watch Top most value of a column in a Table in Watch Window
DataTips
Datatips has been enhanced with the new Visual Studio 2010 shell, and we have also fixed the Datatips to work with StoredProcedure and Triggers debugging. Pinned Datatips is one such enhancement described below.
Pinned DataTips
The new “DataTip pinning” feature enables you to better see and track variable and expression values when in the debugger. To pin a datatip, simply hover over a variable or expression within the debugger to expose its DataTip and then click the “pin” button on it to make the DataTip always visible. One more advantage with pinned Datatips is that they are saved across debug sessions. This means that if you stop the debugger, make changes in your script and start debugging again, any Datatip pinned in the previous sessions will still be there.
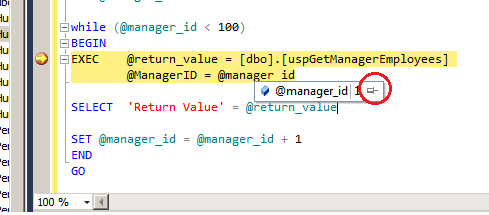
Figure: Datatip when hover mouse over the var @manager_id
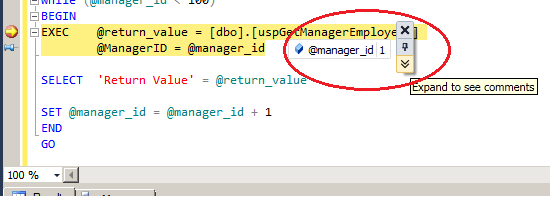
Figure: Pin DataTips to source code
Debug SQL Server 2005 instances from Denali SSMS
Till now, we supported debugging SQL 2008 and above servers from SSMS. But sometimes customers have old SQL 2005 instances which need to be debugged. The only way to do that currently is to use Visual Studio. To help with this, we have enabled debugging support for 2005 servers as well from SSMS.
From SQL11 SSMS, you can simply connect to SQL Server 2005 and avail all the debugging functionalities on 2005 servers.
Note: The 2005 server must have SQL Server 2005 SP2 installed. Otherwise debugging will fail.