Analyzing Backup Activity with PowerBI
This time it’s all about Power BI.
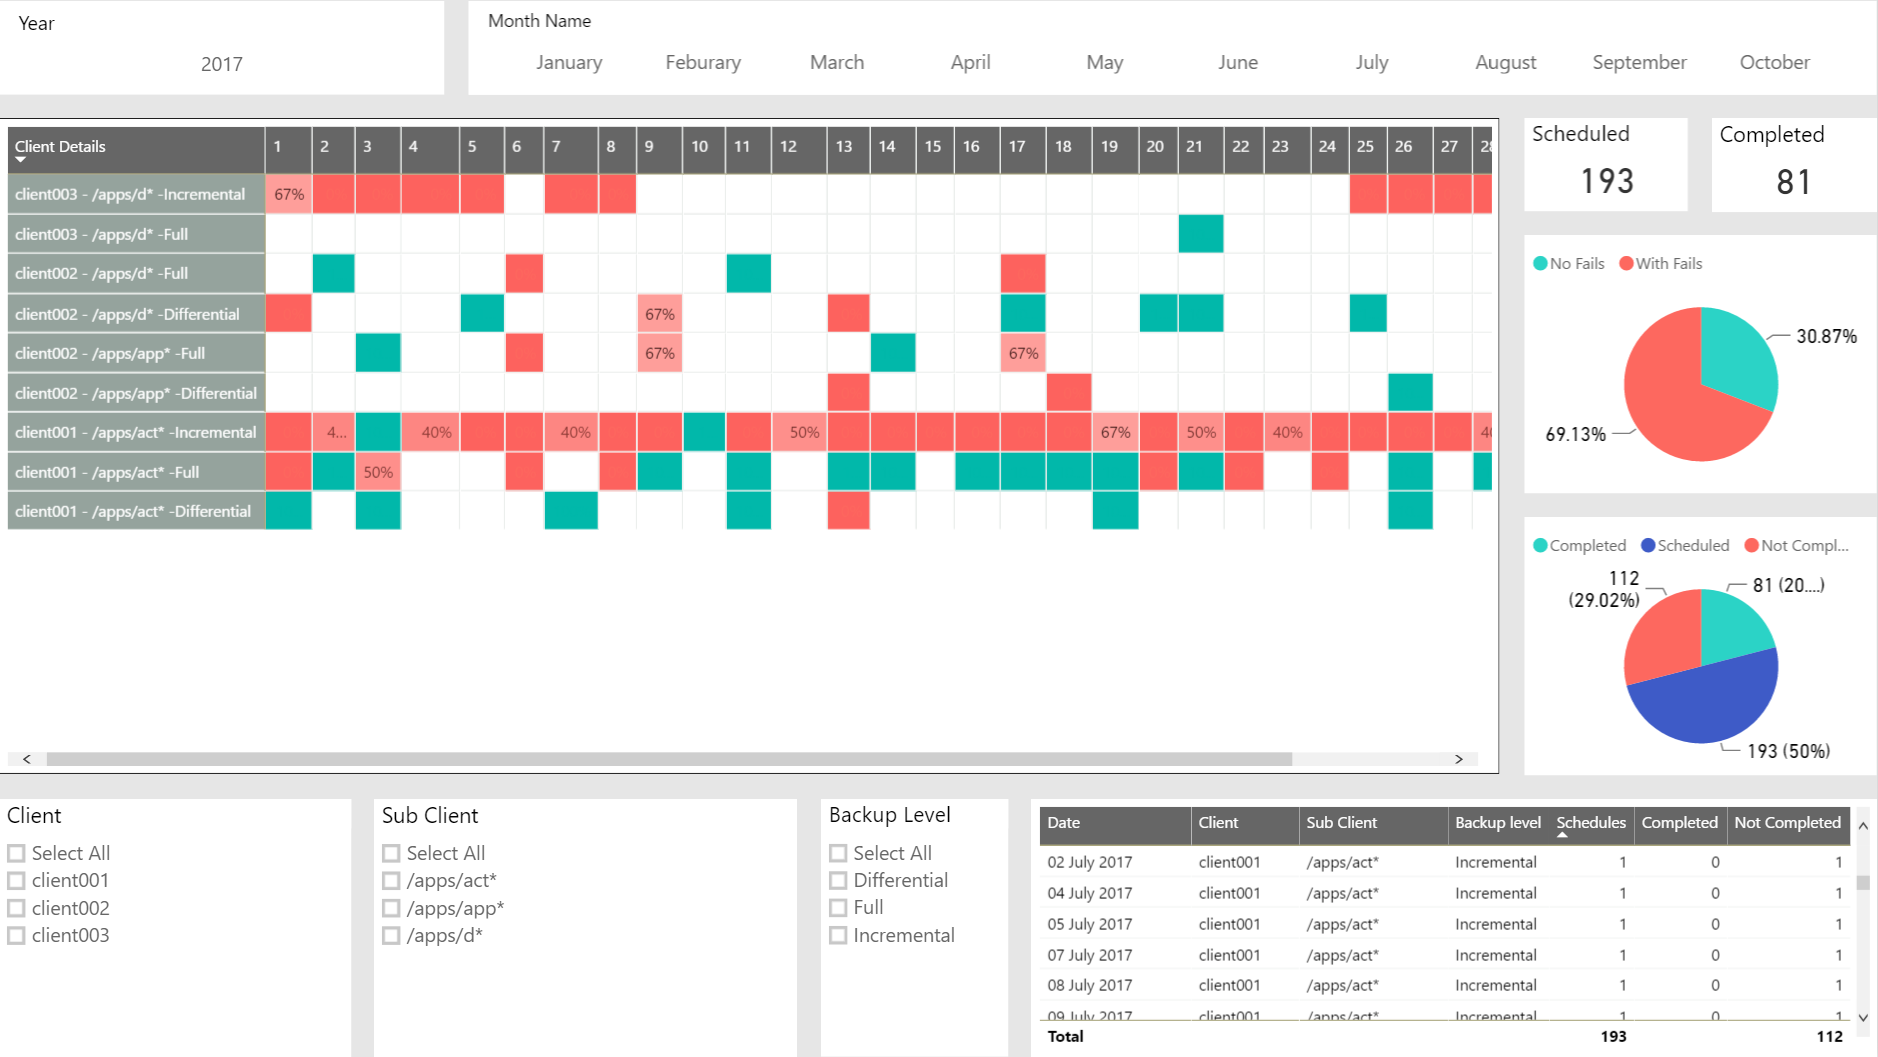
The challenge was to visualize in some kind of calendar style the daily activity of backups.
Starting with a detailed activity log, adding a couple of calculated columns and measures, we´ve ended with a pretty slick looks that helps to understand bubbles of failed backups or empty slots that can be used for schedules.
In this particular example, the log comes from an export of the backup solution and the structure looked something like this:
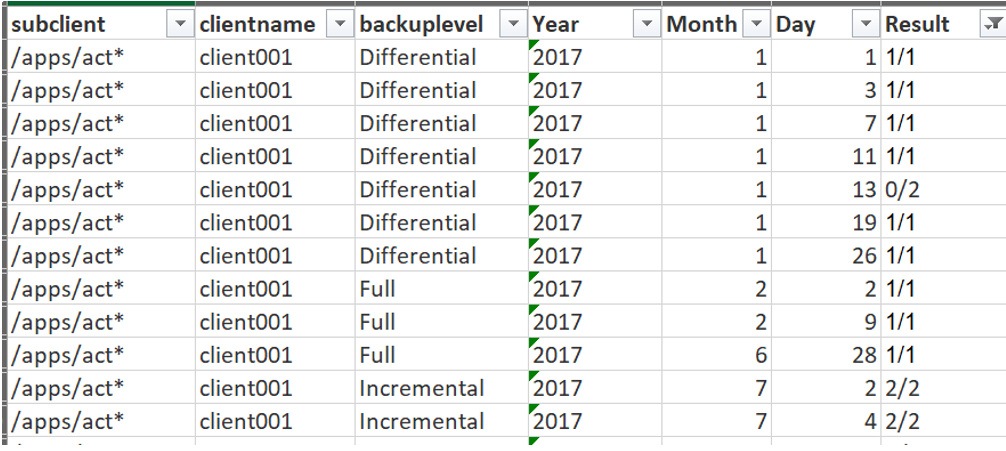
Not bad, at least there’s no need to major data transforms or aggregations.
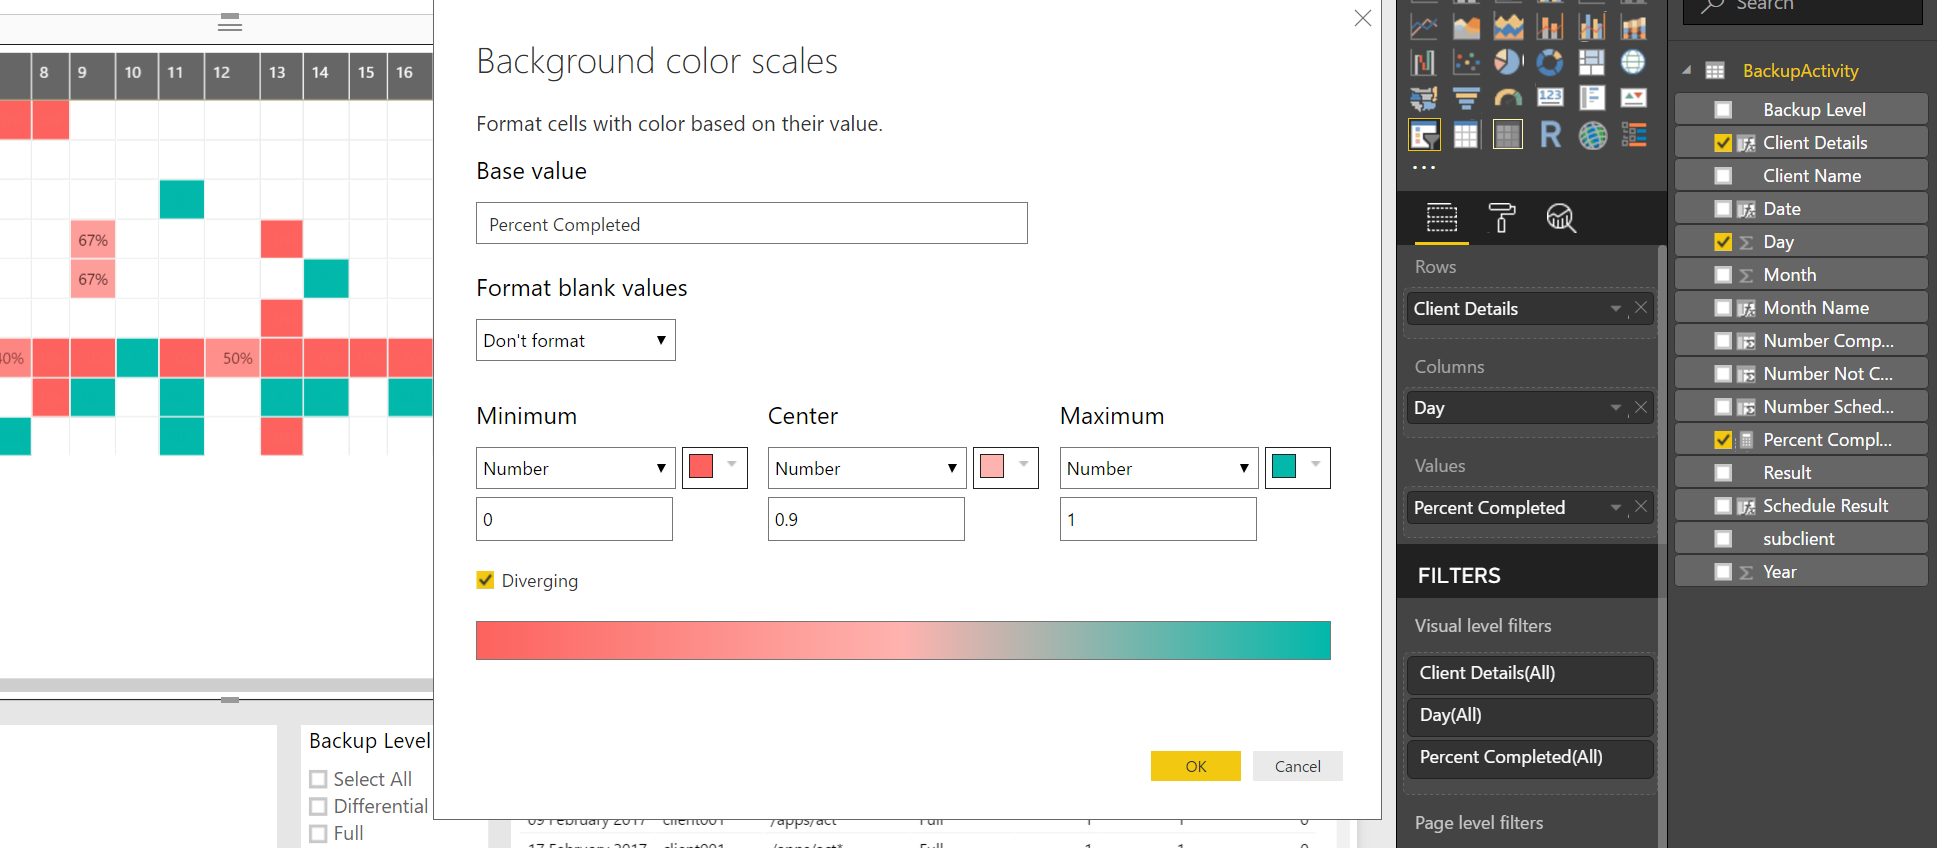
So now is just a simple import into Power BI and start creating some calculated columns and measures like such:
Client Details = BackupActivity[Client Name] & " - " & BackupActivity[subclient] & " -" & BackupActivity[Backup Level]
Number Schedules = INT(RIGHT(BackupActivity[Result],find("/",BackupActivity[Result],1,2)-1))
Number Completed = INT(LEFT(BackupActivity[Result],find("/",BackupActivity[Result],1,2)-1))
Number Not Completed = BackupActivity[Number Schedules] - BackupActivity[Number Completed]
Percent Completed = SUM(BackupActivity[Number Completed])/sum(BackupActivity[Number Schedules])
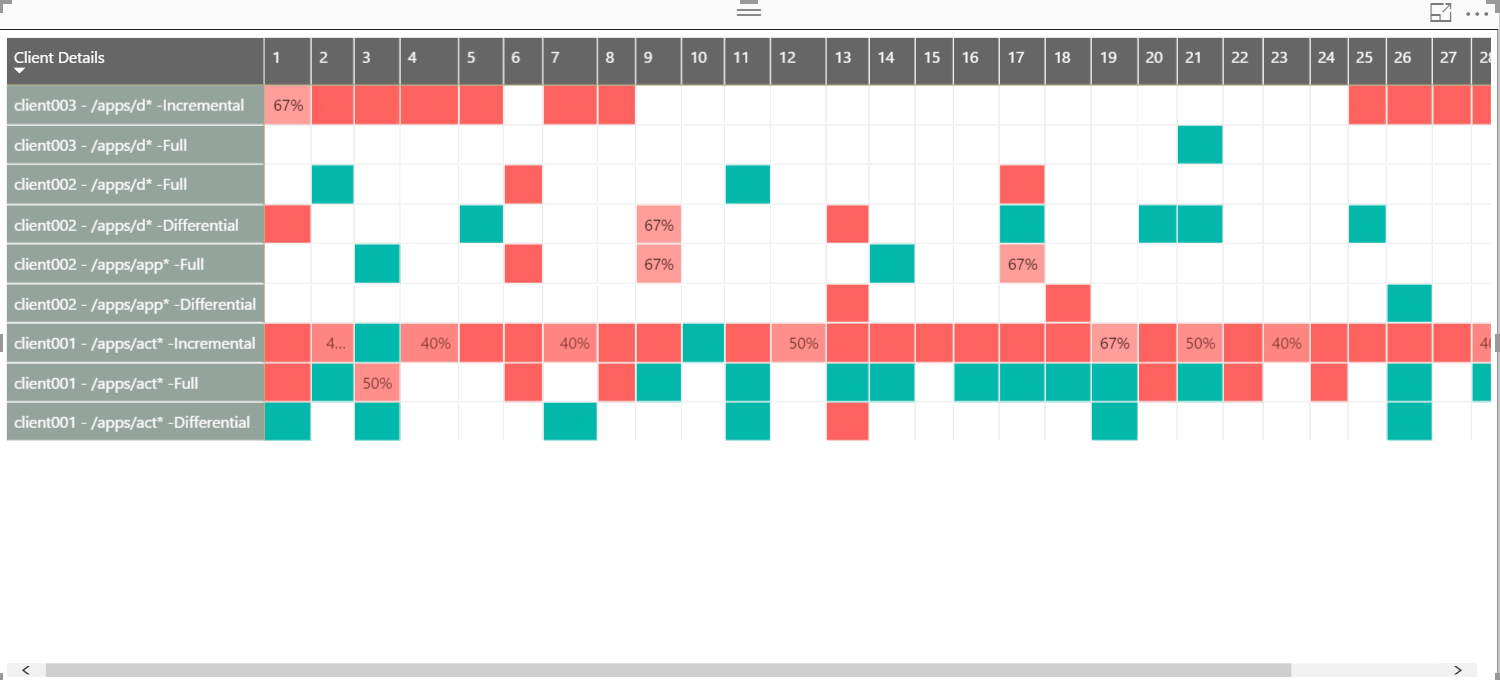
And after playing around with conditional formatting of 'Percent Completed' in a matrix
We´ll end up with a sort of heat map calendar structure that helps to discover some insights of backup activity.
 Refer to this repo ( https://github.com/madiasOnGit/PowerBI/tree/master/BackupActivity ) for the complete report.
Marco