Debugging Pool Leaks with X-Perf
The WDK has a tool called poolmon and you can use it to find leaks as is described in the Windows Internals book. You can use the NotMyFault demo app (here) to demo it.
Instead of PoolMon you can also use WPT and X-Perf. Once installed, you run it like so:
xperf -on diageasy+pool -stackwalk PoolAlloc
Then you repro the leak. Once done you stop the trace with this:
xperf -d leaker.etl.
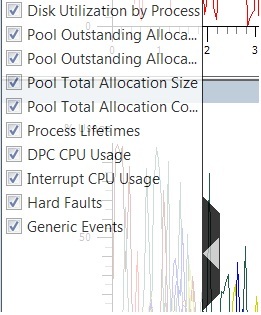
When you then open the trace in XPerfView, you will see four pool graphs in the fly-out:
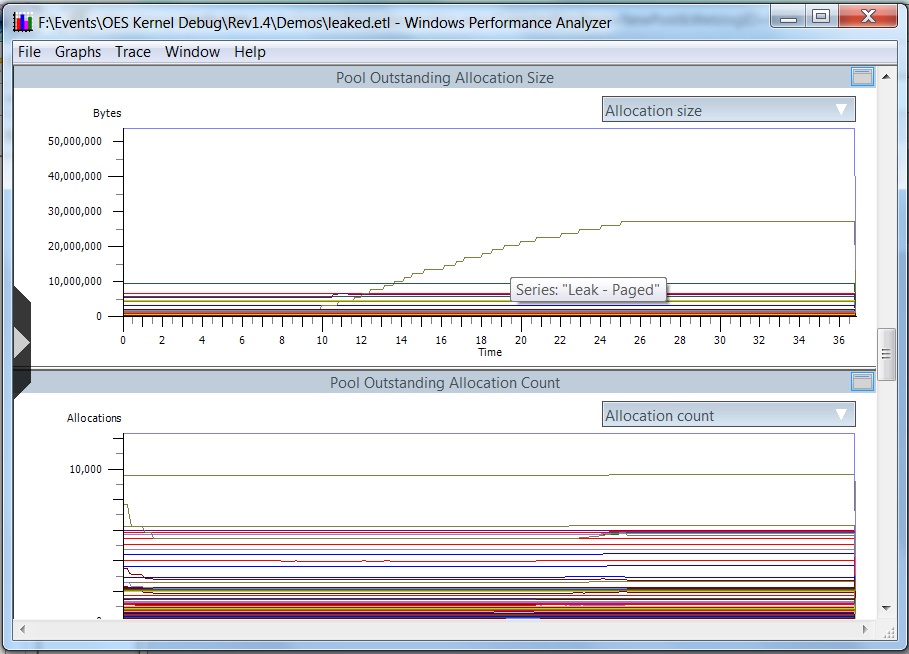
When you go to one of the graphs, you'll see a nice jagged line in there. Hovering the mouse over the graph will show the pool tag associated with the pool allocations.
But there is more. When you select the jagged line in the graph, right-click and get the summary table you can actuall get the call stack. You have to rearrange the columns a bit. Pooltag first, then call stack will be good. Throw the type column to the right. Of course you need to have symbols loaded. But here is what you'll get:
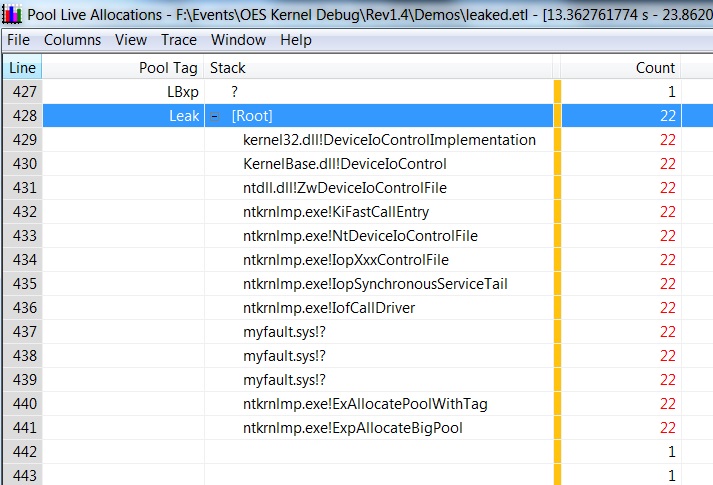
This is obviously a convoluted scenario with a large frequent leak from NotMyFault. Nevertheless, it is easy to get to the culprit. If you have symbols for myfault.sys available, then you would right there and then have the function and source line.