Visualizing London's open data in Power BI
Today we're visiting London, UK. In previous posts, I've looked at data from Seattle and Chicago. Now we're headed across the pond to see data from the UK. Specifically, the Greater London Authority has a myriad of data available at London Datastore. The datasets are generally covered by the UK Open Government Licence (OGL) but some have specific attributions and licenses requirements. So, lets get this out of the way - the data used in this blog post "Contains public sector information licensed under the Open Government Licence v2.0."
This treasure trove of information invites a lot of visualizations. But where should I begin?
Glad you asked! Turns out there's a catalog of all the data feeds available from the City of London in a handy CSV format. The data set has a really good set of attributes including direct links to datasets, attributions, etc. While there is a search feature on the website, it's somehow not as interactive as I'd like. So let's take a look at how we can sift through London's datasets using Power BI Desktop.
Resources
Download: London Data Feeds Index.pbix
Download: Power BI Desktop if you don't already have it
Download: the London Datastore Catalogue CSV file
More data, updated more often
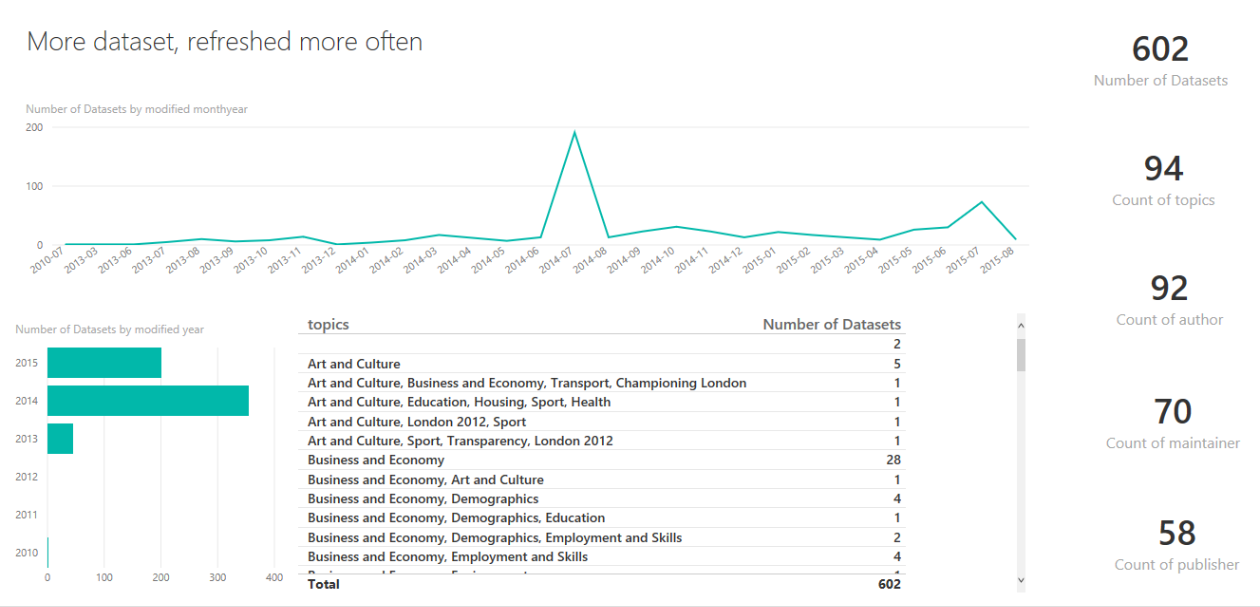
I started by looking just to see how many data sets London publishes and how that has changed over time. Here's a great view that shows London is publishing or updating more data sets today than a year ago. You can see there are 602 datasets we could analyze - a cornucopia of data! You can see that the number of data sets updated in 2015 is already on pace to exceed 2014. So not only is London publishing data, but it's keeping the data updated as the months go by.
Loading the data
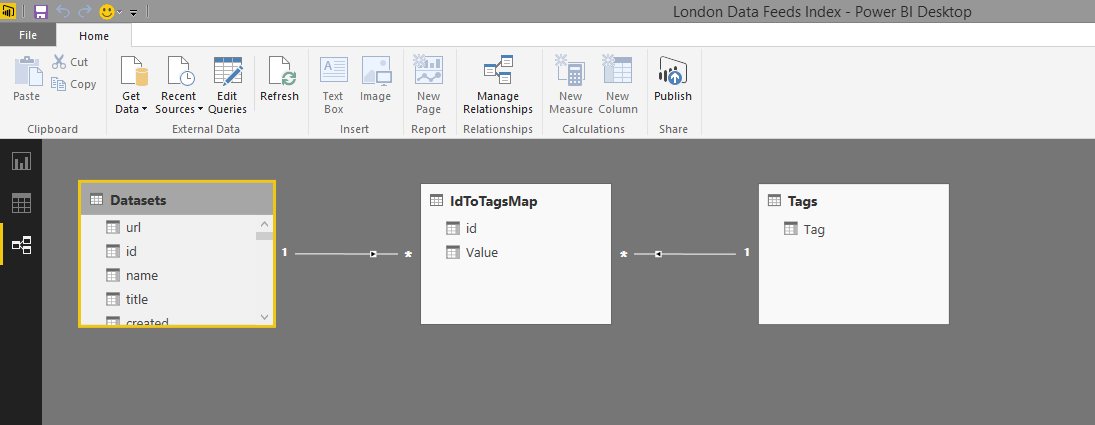
Loading the CSV file is very easy in Power BI Desktop. I just clicked Get Data and selected CSV. The basic CSV was loaded correctly with all the data types correctly detected. There were a few things I spotted that I wanted to do to make the data more useful. To start there's a URL field - I want it to be clickable when used in the report so I changed the Data Category for the URL field to "Web URL". Then there's the tag field. Its a single comma separated field and I wanted to see which were the popular tags. To do this, I needed first to isolate each tag value and then ensure I could slice and dice the data feeds based on the tags. Getting there required two additional tables. The first provided the unique tag values. The second related the tags to the IDs. You'll see in the Power BI Desktop file, I created relationships across the detail table and the two new tables to ensure I could filter the values. Importantly, I used the ID column from the IdToTagsMap table in the main table for tags to force the use of the relationships during filtering. You can see why this is needed in the image below, where the IdToTagsMap table is on the 'many' side of the relationships from the Datasets and Tags tables.
A searchable index of London datasets
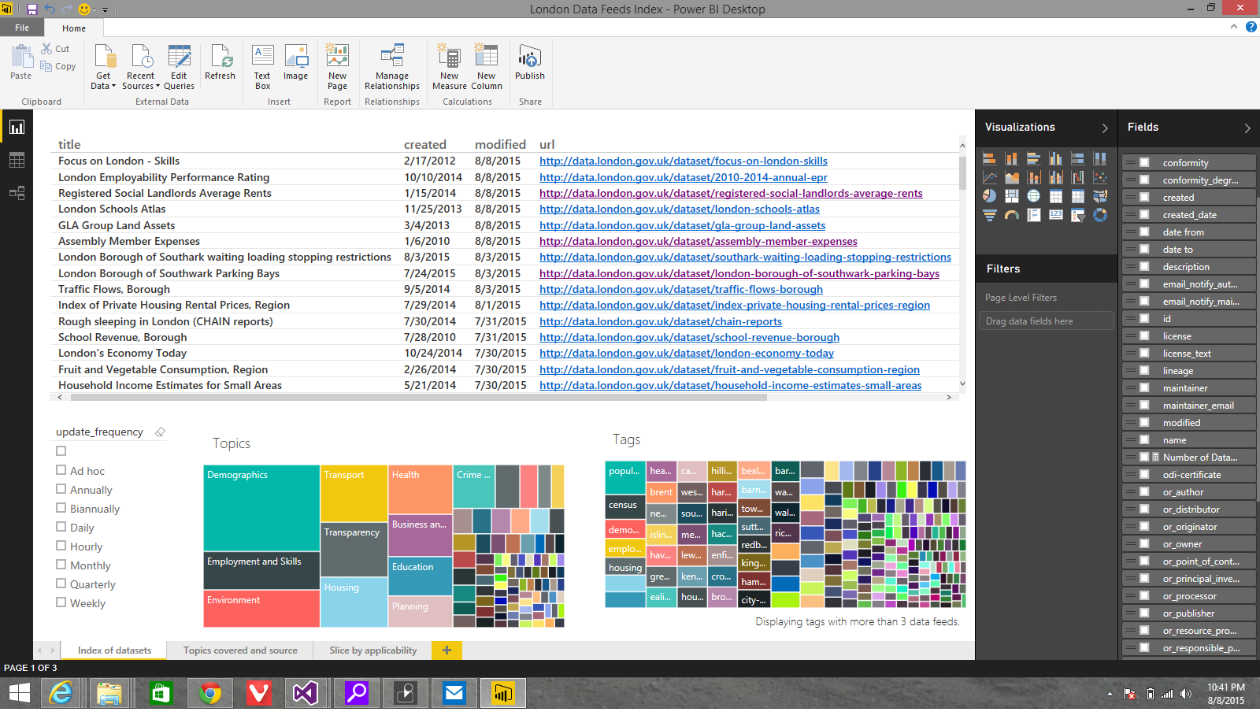
When you have so many datasets, it's hard to find all of them. So the sheet below shows how I created an interactive index of all the datasets published for London. You can filter on Topics, by Tag, or the update frequency. Since it's an interactive sheet, you can use any of the Fields to build additional filters or modify the visualizations. One thing I immediately noticed is there's a ton of 'tags'. Many datasets have unique tag values that actually are compound name that include other tags in a single long string. So I filtered out the tags with few datasets. I set the filter on the tags visualization so I could show all the datasets in the other charts. This single view would make any student doing homework and looking for data from London really happy.
Drilling into Topics and Publishers
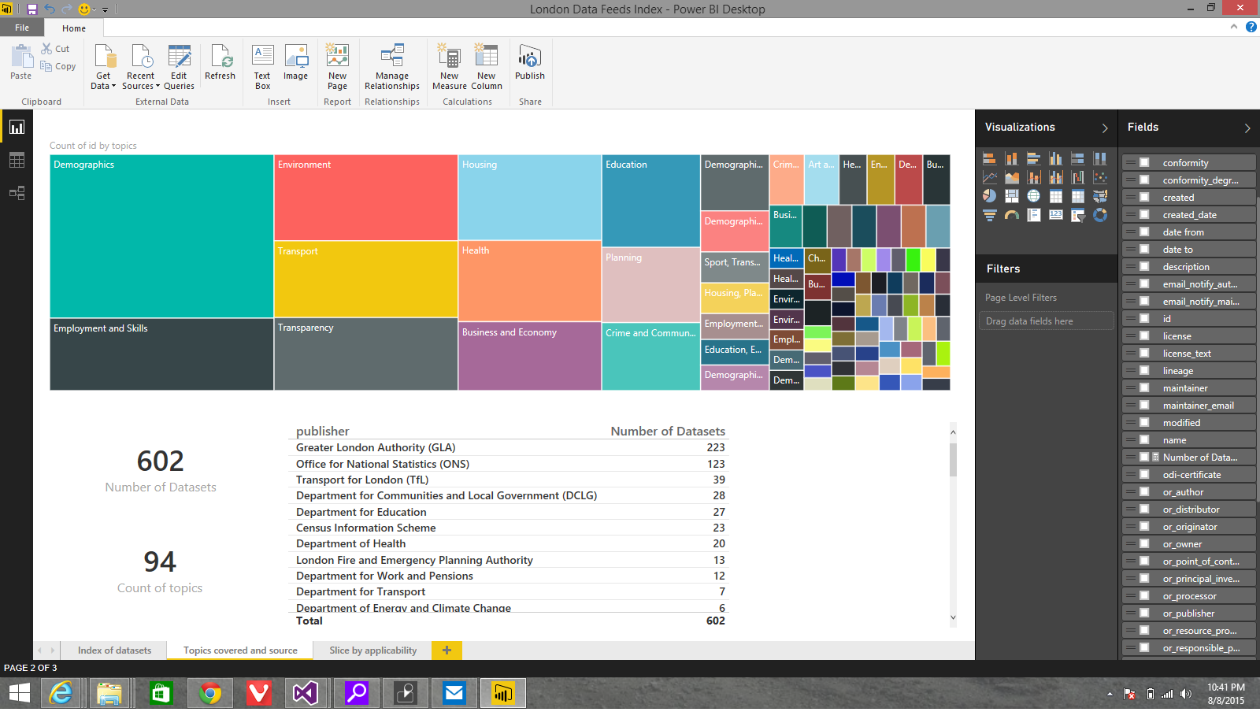
The view below shows the top topics by number of datasets. You can clearly see where the UK government and the City of London are spending their 'data dollars' err.. 'data pounds' :). It's clear to see that normal topics like demographics, employment and skills, environment, transport are of primary importance. But the 'transparency' topic is an interesting find. Should be a useful area for citizens to dive into. You can also see that the 3 biggest publishers, by number of datasets, are the Greater London Authority (GLA), Office of National Statistics (ONS), and Transport for London (TfL).
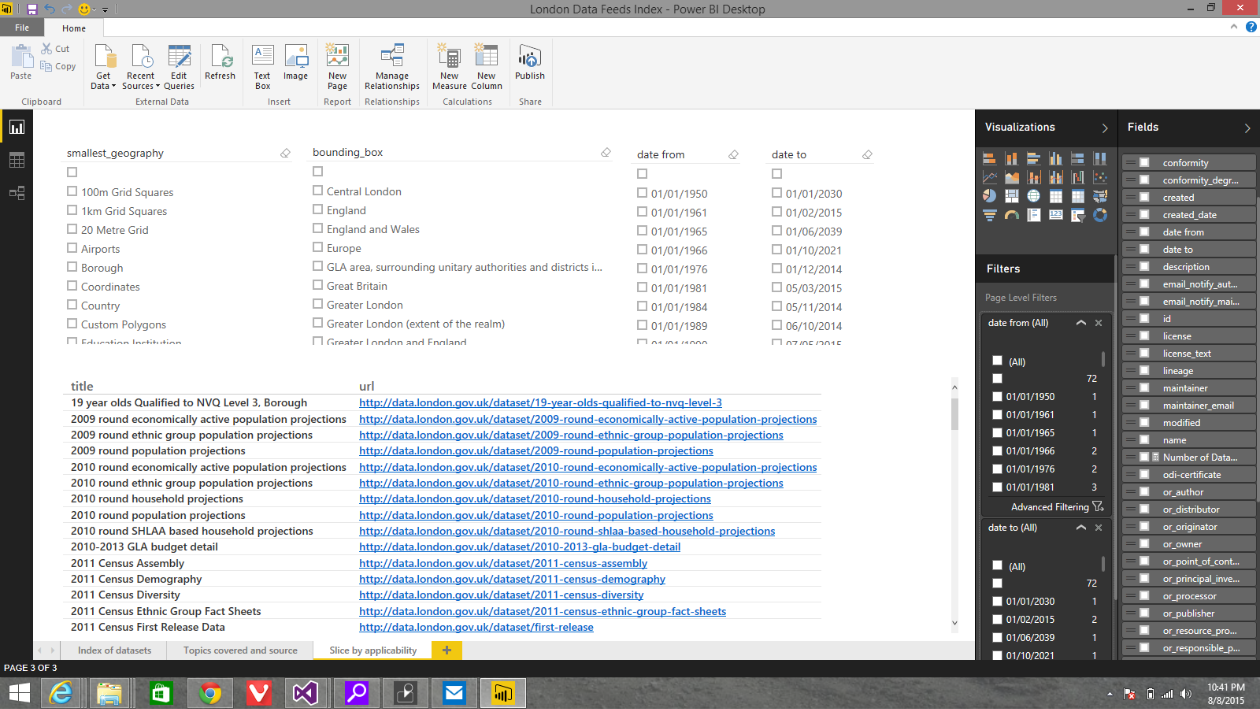
Slicing and Dicing
I built the view below to help me understand the datasets more. I can clearly see which data sets apply to which geographic area - I especially liked the 'smallest geography' attribute since it makes finding relevant data very easy. The 'bounding box' attribute was similar so you can understand the applicability of the dataset at a glance. Lastly, the 'date from' and 'date to' attributes help you find interesting historical reference data. For example, one of the data sets, Global City Population Estimates, goes all the way back to January of 1950! It might be the subject of a future blog post.
Wrapping up
Building the initial index of London datasets was accomplished in a couple of minutes. I was able to slice and dice quickly. Once I got into features like analyzing by tag I had to put a little more work into it, mostly because I don't do that kind of thing very often. It was simple to do using the built-in UI. Having this index, that is easily accessible, searchable, and filterable with drill through to each of the pages hosting the data feeds is remarkably useful I think. Would really like to hear from other folks who have compiled data sets like this one.
HTH,
-Lukasz