Working with JSON data in Power BI Desktop's query tab
I'm helping some journalists get up to speed with Power BI and walking them through how to load common data sets into Power BI Desktop. A recurring topic of interest is how to load government data, including unemployment rate. Here's a report I created to show what you can make with Power BI, click through to see it.
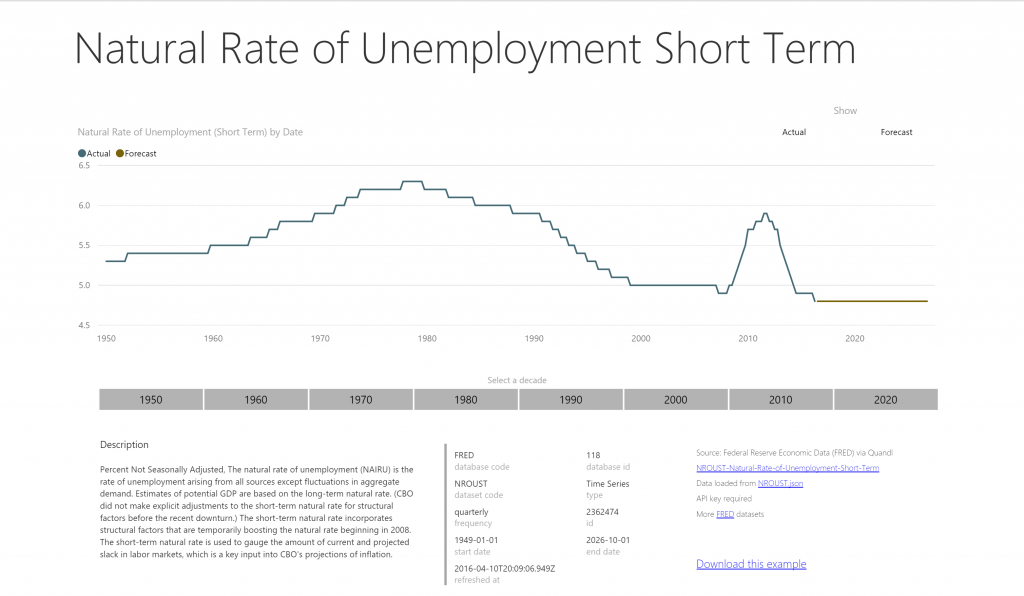
While there are many sources to choose from, commonly this data is available using a URL which downloads the data in JSON format. If you're a journalist or analyst needing to repeat your analysis over and over, you'll save time - no more manually downloading CSV or Excel files. Sometimes you're lucky - the JSON data is 'flat' or flat enough that you can use building pivot, unpivot, expand column, and other built-in transforms to wrangle the JSON into shape.
But what if the JSON data is not 'flat'
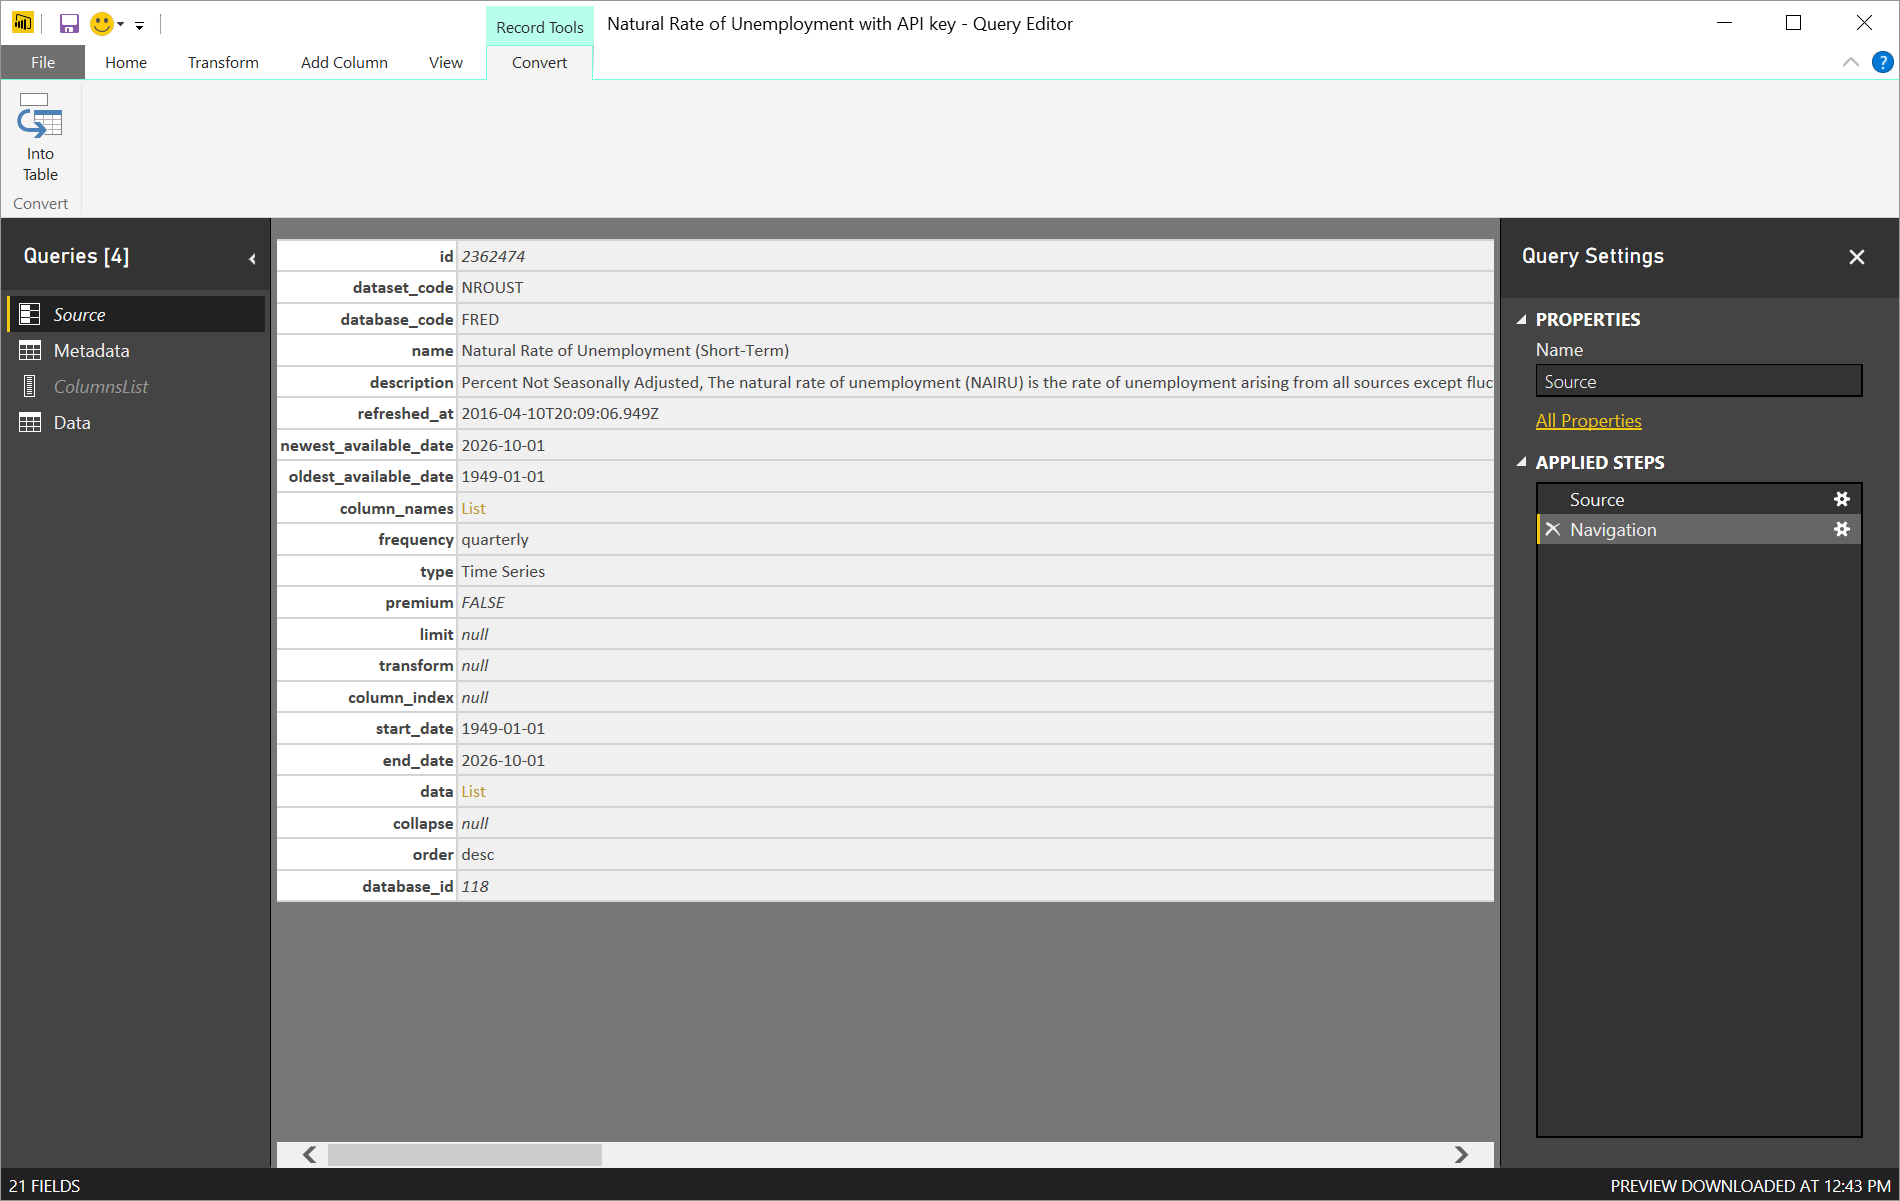
Here's what I'm talking about. I have a JSON file with some metadata, a list of columns and a list of data. Now what?
Well the query tab in Power BI has what it takes to make quick work of this JSON input. Here's how.... but first download the example to see the whole thing. You'll need to get an API Key from Quandl to see the queries in action.
Start by divide and conquer
I load the data using the web source under "Get Data". I split out the 3 components (metadata, columns list, data list) into separate queries using the 'reference' option on the right-click the query. I do that for each of the components. Then I tune each of the resulting queries to do what I need it to do.
Pro Tip: In the Query tab, you can change whether the data loads to the data model or not by unchecking the 'enable load' option on the right-click menu for a query. It's super useful, give it a try.
Looking up column names
Notice that I kept the ColumnsList query as a 'list' that shows the column names, you'll see how I use that in a minute. When I expand the 'Data' query, I just get a single column with values, but they're all jumbled - I can't tell yet which value is from which column. To solve that I follow a pattern you should know.
First I add calculated columns in the Query window as follows:
Table.AddIndexColumn(#"Expanded Column1", "Index", 0, 1)
ColumnIndex = Number.Mod([Index], List.Count(ColumnsList))
Column Name = ColumnsList{[ColumnIndex]}
The first column I created using the "Add Index Column" option on the "Add Column" ribbon. For the others, I use the "Add Custom Column" option in the same ribbon.
So how does that work?
Queries in the Query tab can refer to each other. So you can see that two of my custom columns refer to the ColumnsList query. The first uses the number of values in the ColumnsList query to provide the index of the column name from that list using the handy Number.Mod function. Mod is really useful, it's a good trick to have up your sleeve. Then I get the column name by getting the column name from the ColumnsList by reference. The {} let me index into any list in the query tab. That's another good trick.
From column names to regular columns
Second, I use another pattern to get the values into columns with correct labels.
Date = if([Attribute] = "DATE") then [Value] else null
Value.1 = if([Attribute] = "VALUE") then [Value] else null
Fill Down on Date
Filter out nulls on Value.1
Now I have a dataset I can plot easily in Power BI, so I'm done. Time to close and load!
Where this works, and where it breaks down
For a small number of columns, this approach works great. As the number of columns increases you'll need to repeat the pattern for each of the columns. For 10 or more columns, it gets tedious, but doable. 100 columns... well I might search harder for an alternate data source. However, there's a silver lining: if you're reporting on or analyzing this kind of data often, you'll be building a library of 'go-to' Power BI Desktop files you can refresh at a moments notice to get the data you need.
-Lukasz