MEX Debugging Extension for WinDbg
Hello All, I'd like to share with you guys that like to analyze dump files the following tip:
The official version of the MEX extension publish was released and it is available for download at:
https://www.microsoft.com/en-us/download/details.aspx?id=53304
This extension is widely used by Microsoft Support Engineers in troubleshooting process applications.
After performing the download of MEX, you just need to extract the DLL to the winext subdirectory of WinDbg.
WinDbg is a user mode and kernel mode debugger with a graphical interface that uses the infrastructure of debuggers NTSD, CDB and KD to provide a more similar environment with Visual Studio, with watch windows, visual breakpoints on lines of code and other facilities for example, view variables (including C ++ objects), stack traces, and memory.
Examples of some MEX extension of commands:
.load mex
This command is used to load the MEX extension inside WinDbg so we can access the commands.
!mex.help
This command displays the help of MEX extension grouped by category.

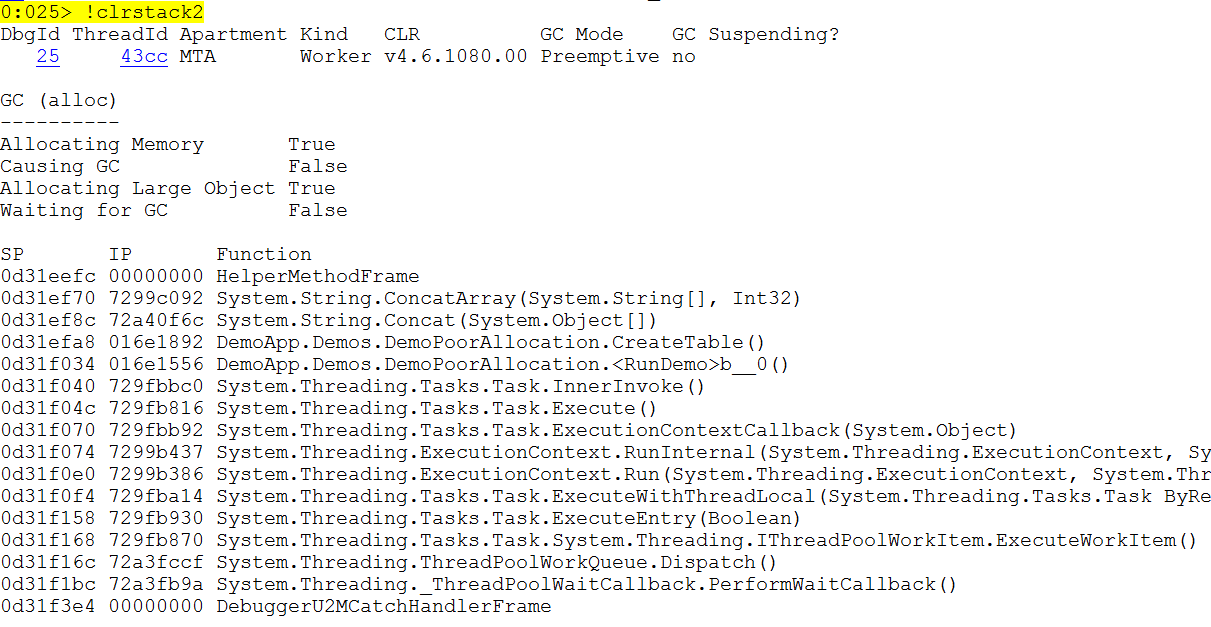
!clrstack2
This command is used to display the managed call stack of the current thread.
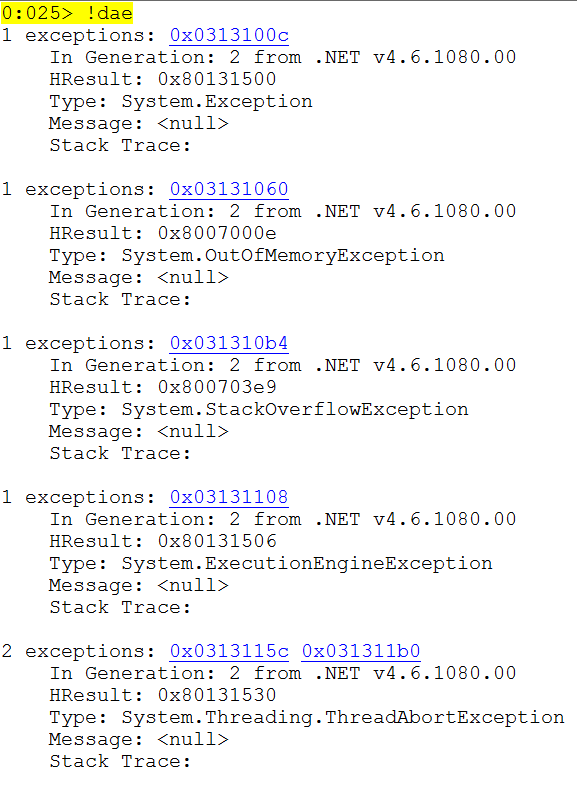
!dae
This command is the DumpAllExceptions abbreviation. It lists all the exceptions that were in memory at the time when the DUMP was collected.
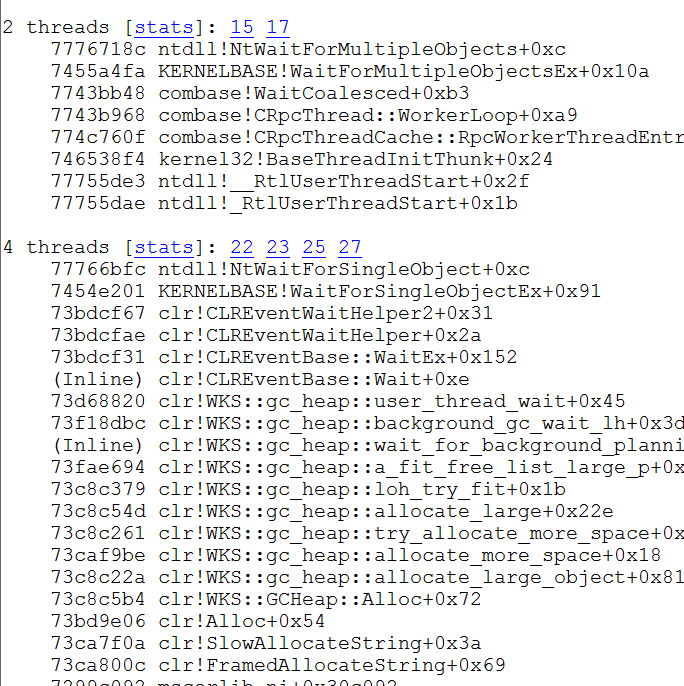
!us
This command is short for UniqueStacks responsible for list all grouped by callstack threads.
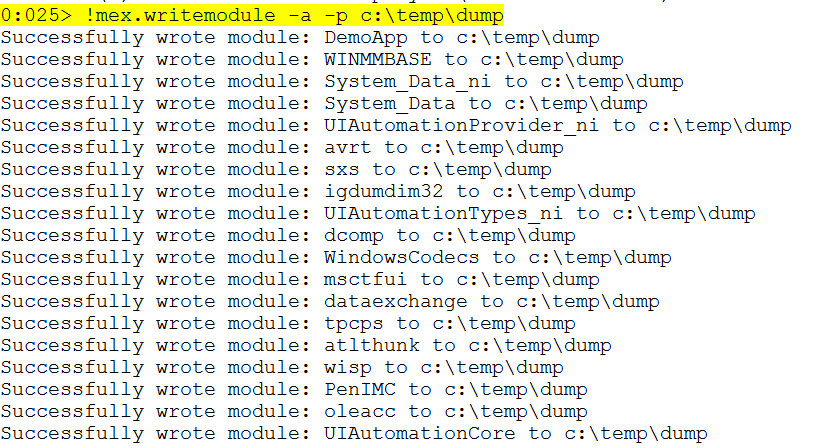
! Mex.writemodule -a -p "destination path"
This command is used to extract all binaries used by the application to an specific path.
!do2 "address"
Short for DumpObject, this command displays the details of an object.
!sqlcn
Provides an overview of ADO.NET connections to SQL Server
I hope that you enjoy it!