Post-mortem Analysis of Userdumps with Debugdiag
This post is an extract of an MSDN whitepaper on debugdiag that will be released soon!
Post-mortem analysis with the windows core debuggers (windbg.exe or cdb.exe) is a time consuming process and requires a lot of debugging skills.
Automated post-mortem analysis of usedumps is basically one of the main goals of debugdiag. It is delivered via the analysis module of the tool and promises to give accurate solution by:
· Separating the raw data extraction from analysis algorithms.
· Providing a script based solution for building analysis algorithms, thus reducing the debugging skills necessary for implementing such analysis scripts.
· Providing an extensible object model solution to meet the demands of future unidentified requirements.
· Providing a built-in HTML based report generation and formatting solution similar to ASP pages.
Debugdiag is shipped with 2 main analysis scripts CrashHangAnalysis.asp and MemoryAnalysis.asp. The former is for analyzing crash and hang userdumps while the latter is for memory and handle leak analysis.
Note: Debugdiag 1.0 was shipped with "IISAnalysis.asp" and "MemoryAnalysis.asp" instead.
Before you start the analysis, make sure that you have lined up the debug symbols properly. Debugdiag accesses by default the Microsoft public symbol server, but you would need Internet connection for that. To add or modify the symbol path, go to Tool --> Options and Settings… --> Symbol Search Path for Analysis.
To analyze a userdump, open the debugdiag UI and click the Advanced Analysis view. The following window is displayed:
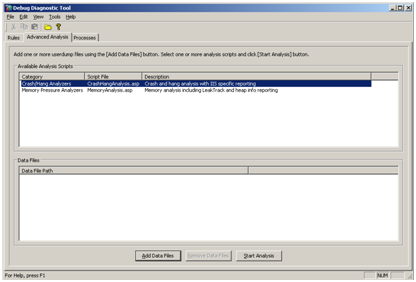
Add the userdumps to be analyzed by clicking Add data Files
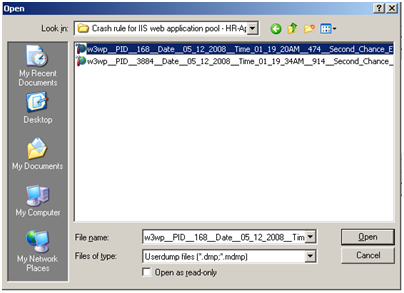
You could select multiple userdumps for analysis, once the selection is made, click Open.
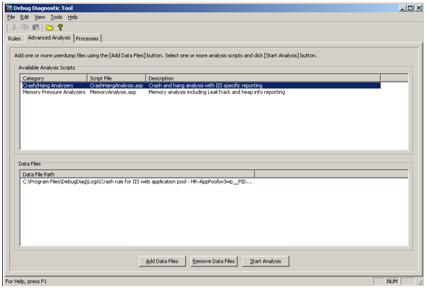
Choose the analysis category (Crash/Hang or Memory Pressure) or you could even choose both analysis categories to run against the userdump(s).
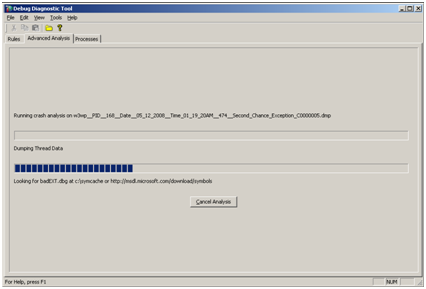
Once the selection is made, click Start Analysis, debugdiag will show the analysis progress as follows.
Another way to start the analysis is from the rules view when the rule has already generated dumps. Right-click the rule and select Analyze data.
You could also start the analysis of a user dump by just going to the userdump in windows explorer and right click the file and choose the type of analysis required.
Once the analysis is complete, debugdiag will automatically save and open the analysis report. The report will be saved in the DebugDiag\Reports folder and will open automatically in Internet Explorer.
Every Analysis report is composed of 3 main sections:
Analysis Summary
The analysis summary is an event viewer type of message that records errors, warnings and information relevant to the userdump analysis along with their descriptions and recommendations to resolve the problem they show.
Analysis Details
The Analysis Details section starts with a table of contents which lists all the memory dumps that are analyzed. For each memory dump, there is a listing of report titles indicating the type of analysis that was performed.
Script Summary
In this section, the analysis will report the status of the script that was ran to analyze the userdump. If there was any error(s) encountered while running the script, this section will show the Error Code, Source, Description, and the line(s) that caused the error(s)