Test applications on virtual environments and file rich bugs
You are testing a complex multi-tiered application. You create different configurations, multiple data sets, and test the different combinations in a user-flow. You come across a hard-to-find bug. You file it and are pleased that your effort was well worth it. But the next morning you realize that your developer has resolved your bug as 'No repro' with the comment 'It works on my box'. You are really frustrated and determined to reproduce the bug again and file it, this time with a screenshot and logs. And the bug ping-pong continues. Does this ring a bell??
Testing and development can be so much more efficient if the bug you filed was rich and actionable in the first place. With Team System 2010, you can automatically create highly actionable bugs with video, screenshots, system info, event logs, and many other types of logs.
Well, there are these nasty configuration issues that will still be hard-to-reproduce for the developer on his environment. What if you could attach the environment snapshot with the bug itself, so the developer can connect to the machines in the same state as they were when you found the bug, and reproduce the problem?? We have good news - with lab management, you can do exactly that. Let's find out how.
After reading this article, you'll be able to:
- Configure your virtual environment to run tests.
- Run manual tests on the application deployed in the environment.
- File a rich bug with your virtual environment snapshot attached to it.
This article is divided into two parts. The first part talks about how to create a virtual environment for testing. And the second part talks about how to run manual tests on the virtual environment and file actionable bugs. Before we end, we'll also show you what the rich bug looks like to the developer and how he can use it.
I. Setup a virtual environment for testing
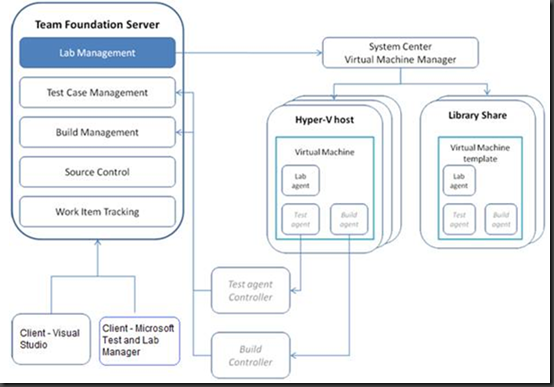
Here is a block diagram of Lab Management components. To be able to run tests and collect logs from environments, you need to first install and configure a test agent controller with your TFS Team Project Collection. Next, you need to install test agent and lab agent on the virtual machines that'll be a part of your environment. You can import the virtual machine and create environment that is ready for testing. Finally, create a test settings that specifies the different logs to be collected from various roles of the environment while you test your application.
1. In order to run tests and collect logs from environments, you need to first setup your test agent controller. The steps to install a test agent controller and configure it with your TFS Team Project Collection are described in steps 15-17 of the Lab Management Beta1 setup guide.
2. The next step is to install agents on the virtual machines that'll be part of your environment. This can be done when you create virtual machines from SCVMM. You need to install test agent and lab agent on the virtual machines to be able to collect logs and run tests on these machines. Steps 20 and 21 of the setup guide describe how to install lab agent and test agent on the virtual machine.
3. Import virtual machines and create environment: This post describes how to import a virtual machine in lab as a 'virtual machine template' and create an environment with it. These steps can also be founding in the 'Create a virtual environment' section of setup guide.
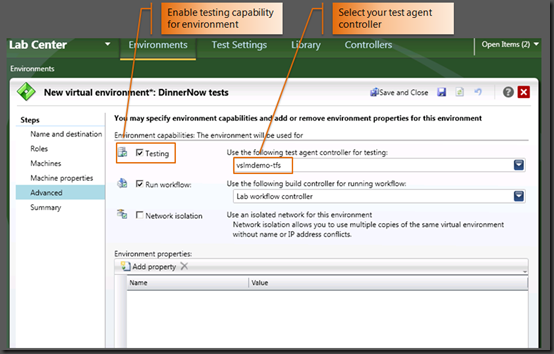
While you are creating the virtual environment, ensure that on the 'Advanced' page, the testing capability is turned on, and the test agent controller you setup has been selected.
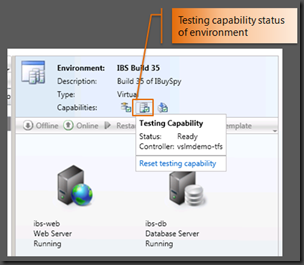
Start the environment and ensure that there are no errors. Once the machines in the environment have started and the testing capability status is 'Ready', you are all set to run tests on the app deployed in the environment.
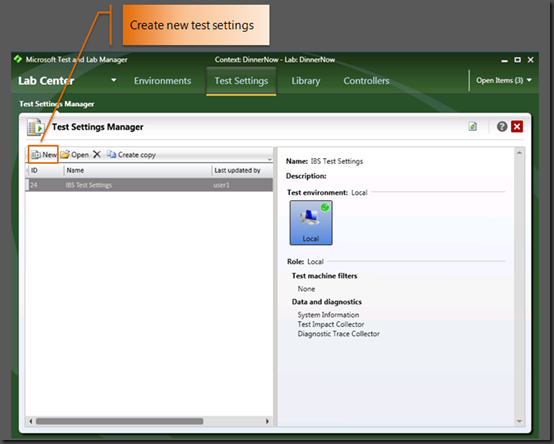
4. Create test settings: Finally, you need to create a test settings that define what logs to collect (and also where to execute tests in case of automated tests) while you run your tests. You now create a new test settings for the roles in your environment.
- Open Microsoft Test and Lab Manager (henceforth called MTLM) and go to 'Lab Center' -> Test settings. Click on 'New' to create new test settings.
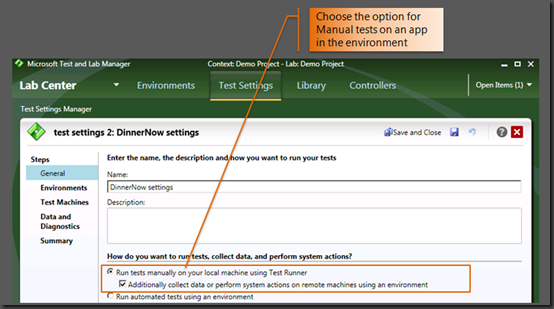
- Enter name and description. Choose testing type as manual (to be used to run manual tests) and select the option to 'Additionally collect data or perform system actions on remote machines using an environment'.
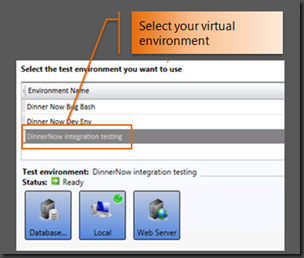
- Go to 'Environments' page. Select the environment you created.
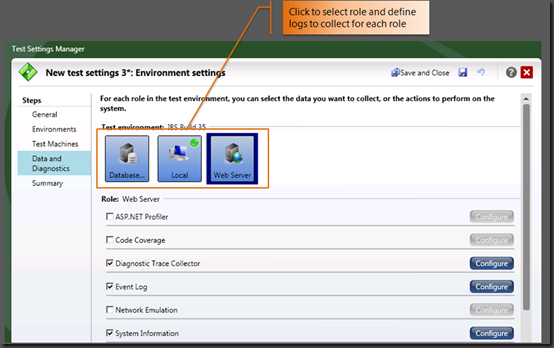
- Skip the 'Test machines' page and go to 'Data and diagnostics'. Here you can define what logs you want to collect while the tests are running. 'Local' refers to the machine from which you'll run the tests using test runner. Click on the various roles and define the logs you need to be collected.
- Verify the settings in the 'Summary' page and click Finish to create your test settings.
So far, we have seen how to configure the virtual environment to run tests and created a test settings. The next section talks about actually running the tests on the virtual environment and filing rich bugs.
II. Run tests and file actionable bugs
You have created your virtual environment and deployed your application on the environment using the workflow. In the meanwhile, the test team has created a test plan for this iteration of the product cycle and added test cases to it. You are all set to test the application. Now, we'll find out how to run manual tests on an application deployed in the virtual environment and create highly actionable bugs, which reproduce for the developer.
Run tests and file rich bugs
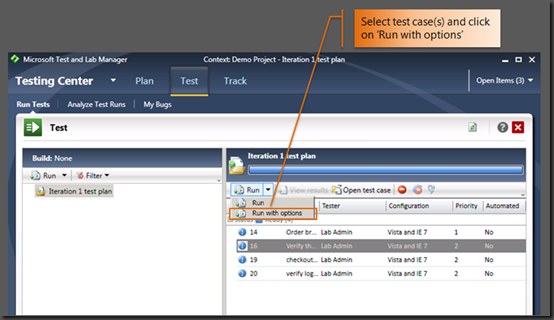
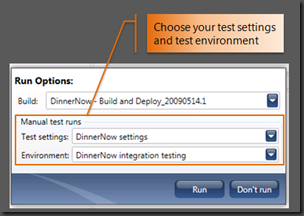
1. Go to the Testing Center in MTLM and select the Test tab. Select your test plan and the set of test cases you want to run. Click on "Run with options " and choose your test settings and virtual environment.
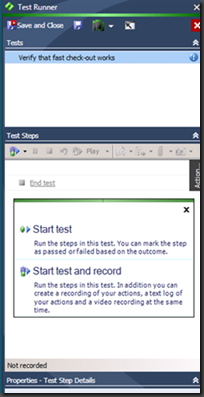
2. The Test Runner window is launched (by default it will be docked to the left side of the screen). Click on "Start test". Launch your client window (IE/rich client) and start running the steps in your test case.
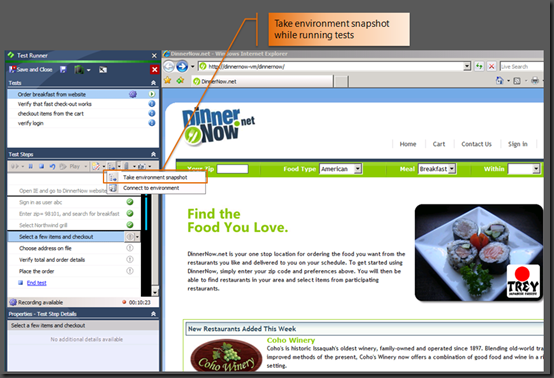
3. While running your test cases, when you find a 'hard-to-repro' bug, you can take a snapshot of the environment by clicking on "Take Snapshot" action under "Lab Actions". The snapshot operation will take around 15-30 seconds. Once the snapshot is completed, you can observe the .lvr file (link to the snapshot) in the bottom pane.
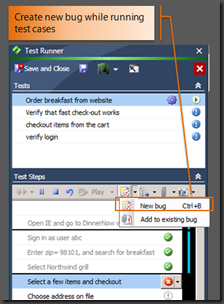
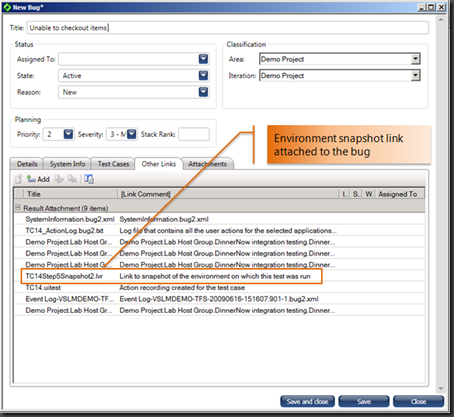
4. Now, create a new bug for the problem you just observed by clicking on 'New bug' action in the toolbar. In the new bug dialog, you can see that the repro steps are automatically filled in from your test case. The 'System Info' tab has information about your local machine as well as the test machines in the environment. Also note that the 'Other links' tab has the different logs from your environment as configured in your test settings and the link to the environment snapshot (.lvr file). Enter a title and save the bug.
5. As you are running your test cases, note that you can connect to the virtual machines in the environment using the "Connect to Environment" option under "Lab Actions" menu. Also note that the .lvr file just has a link to the environment snapshot. The link will be resolved dynamically while the developer clicks on it. The size of the link is only around 1 KB. The actual snapshots are stored on the Hyper-V hosts itself, and use the differencing disk technology to store the changes from last snapshot only. Hence you can attach multiple snapshots to a bug, if needed.
6. Once you are done with testing, click "Save and close" to save the results and restore back to MTLM window.
Debugging using environment snapshot
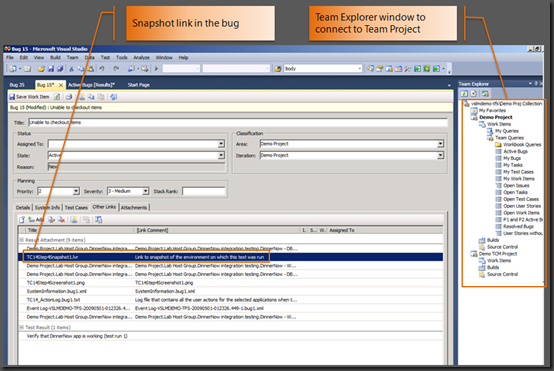
1. Launch Visual Studio 2010. Connect to your Team Project using Team Explorer. Open the query 'Active bugs' under 'Work Items -> Team Queries' and open the bug you just filed.
2. If you go to the "Other Links" section of the bug, you will notice that it contains the link to the snapshot of the environment. Double click on this file to connect to the environment snapshot.
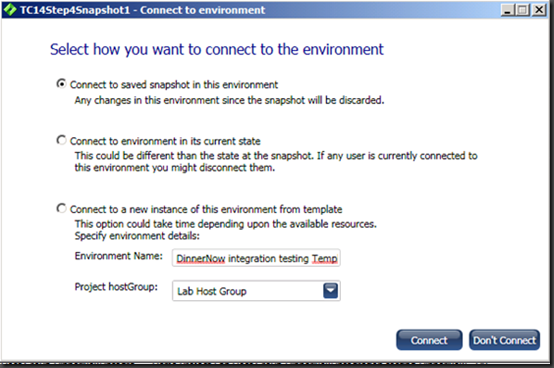
3. You will see a dialog with multiple options to connect to the environment. Let's spend a moment to understand what they mean.
a. "Connect to the saved snapshot in this environment" - Use this option if you want to restore the exact state of the virtual environment at which the snapshot was taken. If you choose this option, you might end up disconnect any user currently using this environment and this might lead to loss of their work.
b. "Connect to the Environment in its current state" - Use this option if you just want to connect to the virtual environment in its current state. There is a possibility that you might still disconnect someone connected to this environment, but you will not restore the environment's state.
c. "Connect to a new instance of this environment" - You can use this option to create your own copy of the environment. This way you will not disturb anyone using the environment currently. However, it will take few minutes for your new environment to be created and it is recommended to use 'Network isolation' capability on environments if you intended to run multiple copies of it.
Note that this option is only available to you if you have stored your virtual environment in the library as a template. You can do so from Lab Center -> Environments and choosing 'Save as Template' action on the environment. If the environment hasn’t been stored in the library, this option is not available.
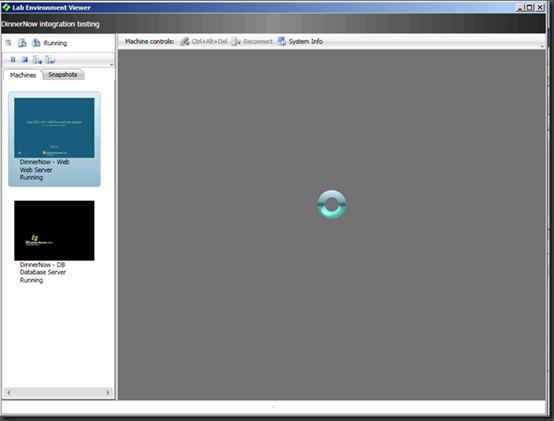
4. Choose the most appropriate option and click on 'Connect'. This brings up the lab environment viewer and connects you to the machines in the environment. You can now login to the machines, reproduce the error, and debug its root cause.
To sum up, you have seen how you can configure your virtual environment for testing, how to run tests and file rich bugs, with environment snapshots so that the developer can always reproduce the problem and debug it.
We hope you liked this and look forward to hear your comments.
Darshan Desai, Program Manager and Bhuvaneshwari K, SDET
Visual Studio Team Lab Management
