SharePoint 2013 noderunner.exe process information
At just about every customer I speak with I always get asked this same question, also after my recent SharePoint 2014 conference presentation I got asked the same question multiple times.
Question:
How do I find out which Search component under noderunner.exe is taking up all my (CPU|Memory)?
Usually after seeing this slide or something similar:
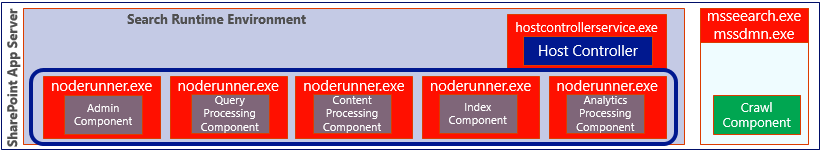
Solution #1 (aka the easy way):
Download Microsoft's SysInternals:
https://technet.microsoft.com/en-us/sysinternals/bb545021.aspx
Specifically Process Explorer or "procexp.exe":
https://technet.microsoft.com/en-us/sysinternals/bb896653
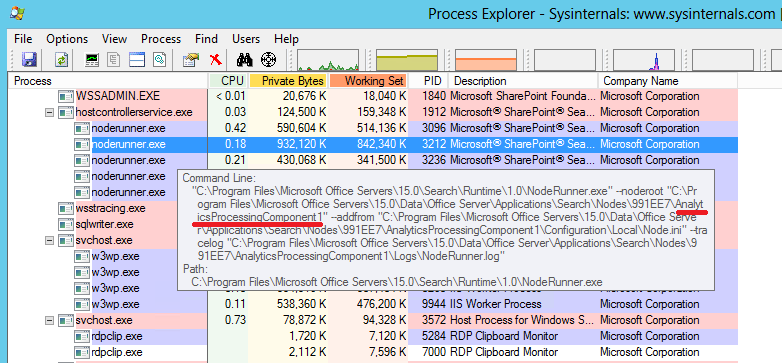
Once this is installed and running you will see the hostcontroller.exe process with the multiple noderunner.exe sub processes.
Mouse over the process that you are seeing CPU or Mem contention with and you will get your answer of which process is causing the issue.
Alternatively you can right click on the titles -> Select Columns... -> Add Command Line and you will see the same information
*Note below the "AnalyticsProcessingComponent1" is taking up the most memory and the PID is there for reference.
Solution #2 (aka the hard way or no install way):
Using WMIC calls you can gather the info needed:
C:\>WMIC /OUTPUT:C:\ProcessListWMIC.txt PROCESS get Caption,ProcessId,KernelModeTime,UserModeTime,PrivatePageCount,WorkingSetSize,Commandline
output:
noderunner.exe "C:\Program Files\Microsoft Office Servers\15.0\Search\Runtime\1.0\NodeRunner.exe" --noderoot "C:\Program Files\Microsoft Office Servers\15.0\Data\Office Server\Applications\Search\Nodes\991EE7\AnalyticsProcessingComponent1" --addfrom "C:\Program Files\Microsoft Office Servers\15.0\Data\Office Server\Applications\Search\Nodes\991EE7\AnalyticsProcessingComponent1\Configuration\Local\Node.ini" --tracelog "C:\Program Files\Microsoft Office Servers\15.0\Data\Office Server\Applications\Search\Nodes\991EE7\AnalyticsProcessingComponent1\Logs\NodeRunner.log" 2696875000 954486784 3212 50110312500 862552064
Where these numbers are the performance measurements:
Memory should be rather simple, this is in bytes.
PrivatePageCount - 954486784 (or 910 megabytes)
WorkingSetSize (Mem) - 862552064 (or 822 megabytes)
CPU, WMI tracks processor time using two different properties: KernelModeTime and UserModeTime. To track total processor time we need to add the values of these two properties. In addition, WMI tracks processor time in 100-nanosecond units. We also divide the sum of these two properties by 10,000,000, something that will convert 100-nanosecond units to seconds
KernelModeTime (CPU) - 2696875000
UserModeTime (CPU) - 50110312500
For a quick PowerShell example on how to convert this, visit the always great scripting guy: