SharePoint 2013 Crawler Troubleshooting Concepts
SharePoint 2013 Crawler Troubleshooting Concepts
Hello, in my years of IT and tech work I have come across many smart people in the field, some amazing system gurus and some coding ninjas, the best of which had a good one basic foundation, a solid grasp of troubleshooting concepts.
If you take a step back and view SharePoint 2013 crawling problems at a 32,000 foot level it is broken down into two main areas:
1. 1. Repository (content) delay or locks (and everything between the gatherer and repository, for example networking).
2. 2. Performance problems based on backend resourcing issues.
This post will focus on #2 the backend resources. I would like to point you to one of my colleagues, Peter Dempsey, blog on SharePoint 2013 Monitor and Tune Content Feed to help determine if it is in fact a repository issue or backend resourcing issue using perfmon or SCOM:
Finding problems in Performance:
SharePoint O15 provides Search Crawl (and Query) Reports “out of the box” which are useful for monitoring crawler activity and performance.
These reports can be accessed by the hyperlinks displayed at the left hand side of the Search Service Application Administration page.
Crawl Health Reports
Crawl Rate
Crawl Rate per Type
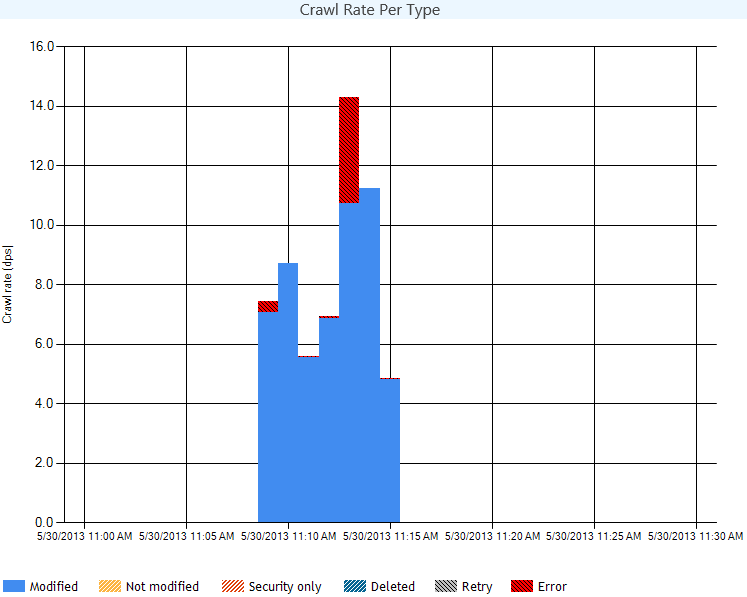
The Crawl Rate Per Type report displays the crawl activities that took place on the items encountered.
The graph displays a timeline per minute of when those actives took place and the table at the bottom of the report displays the total number per type.
This report is useful in finding Security only crawl bottlenecks.
As you can see below my content is mostly just modified data with a small amount of errors, hmm going to have to see whats up with that ;)
Crawl Load
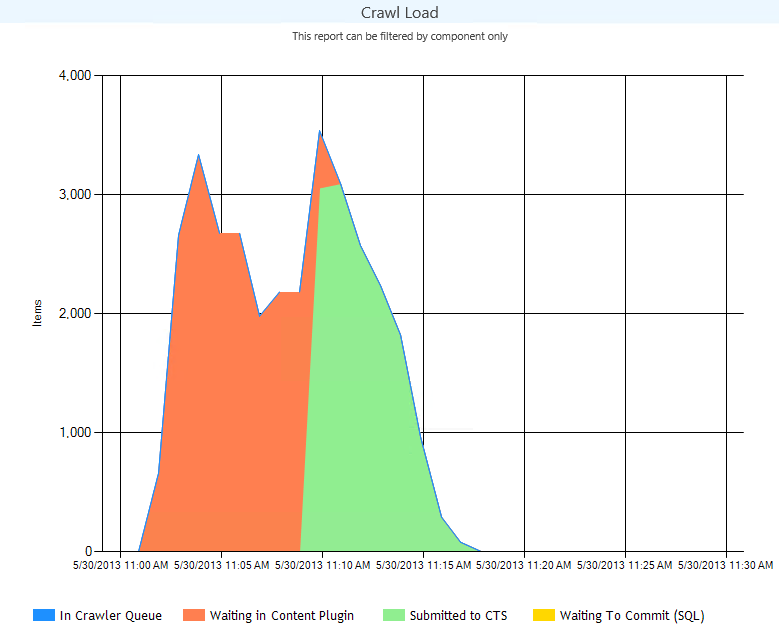
Crawl Load provides data on where and what we are processing. This is an extremely valuable report to pinpoint performance issues.
In crawler queue: Documents discovered and waiting to be processed
Waiting in content plugin: Documents retrieved and waiting to be moved to the CPC component
Submitted to CTS (Or CPC) : Documents in the content processing component
Waiting to Commit (SQL): SQL tables are updated per document
As you can see in the graph below my crawler is very quick but moving the docs from the source to the CPC and sitting in the CPC takes a while, this could be due to resources or not enough CPCs components. Note that SQL is super quick.
Crawl Logs
Validating the Content Sources Crawl Logs should be the second place to look if and when documents are not being crawled or if there are crawling performance issues.
-
-
- Are there any successful crawled docs?
- How many errors? What is the majority of top level errors?
- Is the Repository growing or shrinking over time?
-
Crawl Rate Per Content Source
The Crawl Rate Per Content Source will show the number of documents processed per minute by each content source.
In addition to the graph, the report has a summary table at the bottom. The table lists all the crawls that took place over the time displayed in the report.
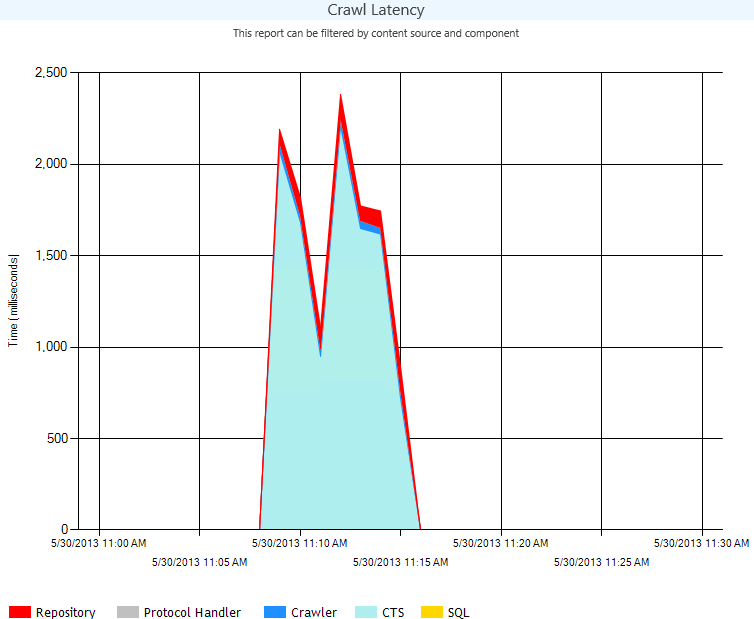
Average Crawl Duration views.
This provides the ability for administrators and support engineers to see if there is a spike in latency for crawling a particular content source compare to the crawls in the last 24hrs / 7days/30 days.
New additions to the Crawler History view are the Crawl rate (DPS) and Repository Latency (MS) .
Previously, the administrator had to go to the crawl health reports to see this info for a particular content source.
Crawl Rate details the docs per second per crawl session.
Repository Latency details latency times in milliseconds during continuous crawl sessions.
Crawl Performance Best Practices
Take advantage of multiple crawl databases and crawl components to avoid the problems of “hungry hosts” and “robot thread” limits.
The search results freshness should be the end users “deliverable”.
For example:
High value content, such as SharePoint sites: updated every 24 hours
Low value content, such as file shares, updated every 7 days.
Middle tier content, updated every 3 days.
These numbers should be determined by running test crawls and monitoring the results. The number of threads per host can be altered can be changed from the default by creating crawler impact rules.
Crawler impact rules allow us to configure the number of threads per host manually.
Determining if the Crawler is in a "Starved State"
Server Resources
One of the first things to check is system resources on the server(s) running the crawler.
The system could be CPU bound, network bound, low or out of memory and/or disk space.
Check these resources and track down the culprit.
If any of these resources are taxed, the next question should be:
Why is the system running out of resources?
Does the system meet the recommended system requirements?
Is there anti-virus or malware software processes active on the system?
If so are the exemptions to the indexer and gatherer tmp files set?
Is there any other applications running on the server that are taxing the system?
How many content sources are being crawled?
Which content sources are marked as High Priority? (found in Content Source config)
Anti-Virus Software
In many customer cases when dealing with a slow/non-responsive crawl, we found that antivirus software was consuming lots of resource on the SharePoint and Search servers.
On the SharePoint Search server:
CPU's spikes 100% utilization permanently (with antivirus process consuming CPU util) until the crawler is stopped.
To resolve this issue, we recommended to exclude the SharePoint directory recursively from your virus scanning.
Here is a KB article that describes which folders should be excluded from antivirus scanning for all SharePoint Servers.
https://support.microsoft.com/kb/952167
A word on SQL:
Tables
Especially for debugging crawl failures, you want to look at MSSCrawlUrl.
You can look at the ErrorIds and look them up in the MSSCrawlErrorList.
MSSCrawlHistory is good to show you anything regarding the status.
Activity Monitor
Activity monitor is great for anything related to performance. It gives a good view into all of the SPIDs that are currently being executed and what they are doing. The key thing to look for is any SPIDs that are long running or resource intensive on the search db. Check it out, look at the logs, use MSSConsole if applicable. The ones that would be most likely to be violators are in terms of session, anchor fix up, and processing crawl.
Profiler
Profiler is very useful to see what is being executed. Filter just on the search database. We typically like to go to the Stored Procedures event category and turn on RPC:Starting and RPC:Completed which shows all the stored procedures being called. We also turn on SP:StmtStarting and SP:StmtCompleted which will take you inside the stored procedure.
Most stuck crawls are due to waiting on a long stored procedure.
Usually proc_MSS_GetNextCrawlBatch and/or proc_MSS_Crawl
Use SQL Activity Monitor to identify which stored procedure is taking time.
A very slow crawl may also be accused of being stuck, when really it is just “starved” for resources.
Crawl starvation is when the crawler is unable to allocate another thread to retrieve the next document in the queue of work.