I don’t see Content-Encoding header in IE HTTP debugger (F12 Developer Tools)
Recently one of my colleagues came across with an interesting question. He questioned why he couldn’t see the “Content-Encoding” header in the IE HTTP debugger but was able to view it in the Fiddler.
First of all, Fiddler and IE are two different products. Their functionality should not be compared at any point of time. I will try to explain as to why we don’t see the above header in the IE HTTP debugger but we can view it in the Fiddler.
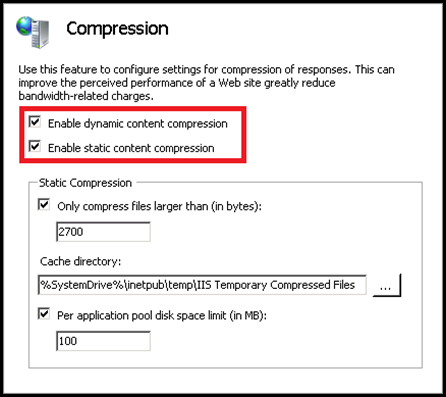
To demonstrate this, I will set-up a simple repro. I’m going to use IIS 7.5 (the latest version) to demonstrate this. Enable Compression in IIS as shown below:
Now, browse the website. For me its the default web site, so I access it over https://localhost. Hit F12 key to launch IE Developer Tools window or IE HTTP Debugger or whatever you call it. Go to the Network tab and click on “Start Capturing”.
Now Launch Fiddler, and click on Clear Cache, so that nothing is served from the cache. Now when I browse to localhost, the traffic is capture by both the IE HTTP Debugger and the Fiddler. Lets take a look at both.
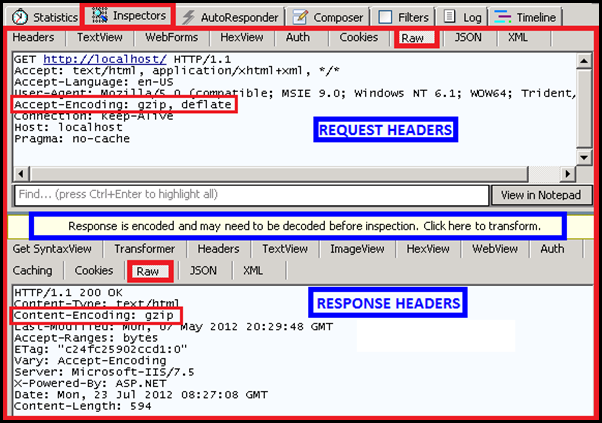
Here is the output from Fiddler:
For those of you who are not familiar with fiddler, to inspect the HTTP traffic after gathering the trace, click on the Inspectors tab as shown above. The upper portion consists of Request headers and the below portion consists of Response headers.
We can see that the Server Response contains the “Content-Encoding: gzip” header in the HTTP Response. For the readers I have also highlighted a portion of the image in blue which reads as “Response is encoded and may need to be decoded before inspection. Click here to transform”.
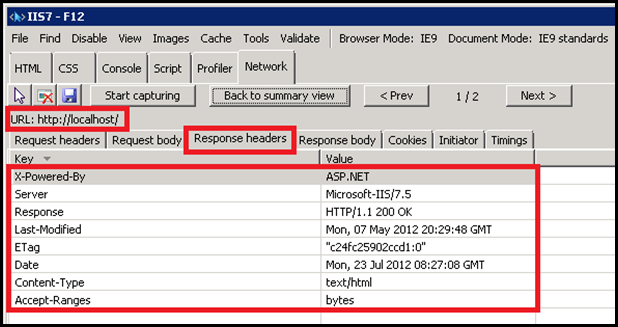
We will re-visit this again, but before that lets take a look at what we see in IE for the same request. Below is what we see in the IE debugger.
Select the URL which reads https://localhost and click on “Go to detailed view”. Here select “Response Headers”. You will see that the Content-Encoding header is missing. Interesting right? you will start wondering why the difference in behaviour.
Reason
The reason we don’t see the Content-Encoding header in IE because it decodes (or decompresses) the response and then reads the header values. It needs to decode the HTTP response as it needs to do this to perform Script debugging and Inspect HTML Elements and CSS Rules. (Probably it would have been better if it read the Response Headers before decoding them so that we look at the complete HTTP Response)
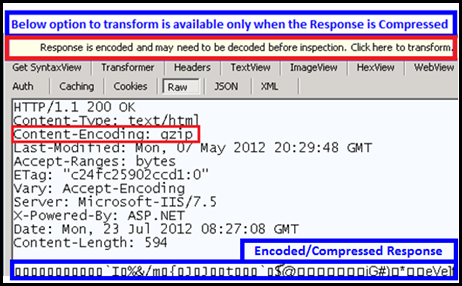
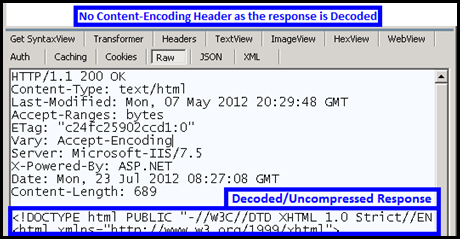
Even in fiddler, you get a option to decode the HTTP Response for the encoded responses. However, once you decode the HTTP Response (Click on “Click here to transform” in the above image), the response is encoded and the Content-Encoding header vanishes from the HTTP Response.
Response Headers in Fiddler before Decoding:
Response Headers in Fiddler after Decoding:
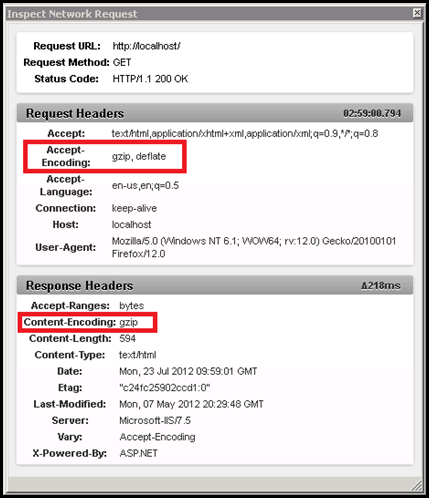
Just to Let you folks know, the debugger that comes with Firefox reads the Response headers before they are processed.
Below Snapshot is from Firefox HTTP debugger:
Some may question as to why cant IE do it. Well, these are different products and have different implementations. No one actually uses the browser for traffic monitoring, you have better tools to do so, like Network Monitor and WireShark. The HTTP debugger was designed mainly for Script Debugging and Inspection of HTML Elements.
Hopefully, the IE HTTP Debugger may become capable of reading the HTTP Response headers before they are parsed or may be it wont. The answer lies in the future.
Until then CIAO! ![]()
