Query optimization
If you would like to Optimize your SQL Server Query, Tune slow queries in SQL Server and make them run faster follow the steps in below blog
A query in considered to be slow when it is executing for longer duration than expected. Total duration of the query can be broken in to compile time, CPU time and Wait time.
Before you start troubleshooting the query which is running for longer duration, Identify if the query is slow because it is long waiting (or) Long running (or) Long compiling.
Compile time: Time taken to compile the query. compile time can be identified by looking at the
1. CompileTime="n" in XML plan
2. SQL Server parse and compile time when Set statistics time on is enabled.
CPU time: Time taken by the query in CPU (Execution time – (compile time+ wait time). CPU time can be identified by looking at the
1. CPU column in profiler.
2. CPU time under SQL Server Execution Times when statistics time on is enabled.
Execution time: Time taken by the query for complete execution ( Execution time +CPU time +Wait time). Total duration of the query can be identified by using the
1.Duration column in profiler
2. SQL Server Execution Times, elapsed times when statistics time on is enabled.
What is long waiting query?
A query is considered to be long waiting query, when it spend most of its time waiting for some resource.
How to identify if the query is long waiting?
Long running query can be identified by comparing the CPU and duration column in profiler (or) CPU and elapsed time when statistics time on is set .
When a query is waiting for a resource (such as lock, network I/O, Page_I/O Etc) it will not consume CPU. So if you see duration being higher than CPU (Difference between Duration and CPU is wait time),It indicates that the query has spent large amount of time waiting for some resource.
Let us see an example of long waiting query. I have collected profiler trace while executing the query.
set statistics io on
set statistics time on
go
--Place your query here
select top 10000 * from a
go
set statistics io off
set statistics time off
go
![clip_image001[15]](https://msdntnarchive.blob.core.windows.net/media/MSDNBlogsFS/prod.evol.blogs.msdn.com/CommunityServer.Blogs.Components.WeblogFiles/00/00/01/17/85/metablogapi/5226.clip_image00115_1C580944.jpg "clip_image001[15]")
Look at the Duration and CPU column in the profiler Cpu=256 and duration =1920. So this query has spent majority of time waiting for some resource.
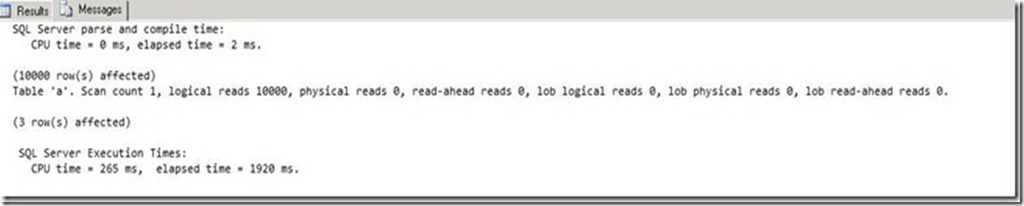
![clip_image002[16]](https://msdntnarchive.blob.core.windows.net/media/MSDNBlogsFS/prod.evol.blogs.msdn.com/CommunityServer.Blogs.Components.WeblogFiles/00/00/01/17/85/metablogapi/0815.clip_image00216_36F47F90.jpg "clip_image002[16]")
Look at the output of statistics time and statistics I/O in above image.
SQL Server has spent only 2 milliseconds compiling the query and 256 milliseconds on CPU, but the overall duration was 1920 milliseconds so the query has spent maximum time waiting for some resource.
Identify the resource in which this query is waiting on using one of the steps listed below.
1. Look at the wait type column of the sysprocesses for the spid which is executing query while the query is executing.
2. If there is no other activity on the server collect sys.dm_os_wait_stats output before and after the query execution and identify the wait (Will not help in tuning queries running for short duration)
3. Collect XEvent to gather the wait stats of individual query.
Once you identify the resource in which the query is waiting on tune the resource. Most of the times queries would be slow waiting for below resource.
PAGEIOLATCH_* or Write log: This indicates I/O resource bottleneck follow the detailed troubleshooting steps mentioned in This Link to fix the I/O bottleneck. If you find SQL Server spawning excessive I/O Create necessary indexes.
a. Logical reads + Physical reads in statistics I/O output (Refer above image) or Reads and writes in profiler will indicate the I/O posted by this query. If you see very high reads for query compared with the result rest retuned by query it is an indication of missing indexes or bad plan. Create necessary indexes (You can use DTA for index recommendations.).
PAGELATCH_*: This waittype in sysprocesses indicates that SQL Server is waiting on access to a database page, but the page is not undergoing physical IO.
a. This problem is normally caused by a large number of sessions attempting to access the same physical page at the same time. We should Look at the wait resource of the spid The wait_resource is the page number (the format is dbid:file:pageno) that is being accessed.
b. We can use DBCC PAGE to identify object or type of the page in which we have the contention. Also it will help us to determine whether contention is for allocation, data or text.
c. If the pages that SQL Server is most frequently waiting on are in Tempdb database ,check the wait resource column for a page number in dbid 2 Ex(2:1:1 or 1:1:2). Enable TF 1118 and increase the number of TEMPDB data files and size them equally (You may be facing tempdb llocation latch contention mentioned in https://support.microsoft.com/kb/328551)
d. If the page is in a user database, check to see if the table has a clustered index on a monotonic key such as an identity where all threads are contending for the same page at the end of the table. In this case we need to choose a different clustered index key to spread the work across different pages.
LATCH_*: Non-buf latch waits can be caused by variety of things. We can use the wait resource column in sysprocesses to determine the type of latch involved(KB 822101).
a. A very common LATCH_EX wait is due to running a profiler trace or sp_trace_getdata Refer KB 929728 for more information.
b. Auto Grow and auto shrink while query is executed.
c. Queries going for excessive parallelism.
Blocking (LCK*): Use the query in This Link to identify the blocking. Tune the head blocker.
Asynch_network_io (or) network IO: Keep the result set returned by the query smaller. Follow detailed troubleshooting refer This Link
Resource_semaphore waits: Make sure there is no memory pressure on the server Follow steps in This Link for detailed troubleshooting.
SQL Trace: Stop all the profiler traces running on the server. Identify the traces which are running on the server using the query in This Link
Cx packet: Set the Max degree of parallelism. But remember Cxpacket wait type is not always a problem.
a. For servers that have eight or less processors, use the following configuration where N equals the number of processors: max degree of parallelism = 0 to N .
b. For servers that use more than eight processors, use the following configuration: max degree of parallelism = 8.Refer This Link
SOS_SCHEDULER_YIELD : Identify if there is CPU bottleneck on the server. This waiting means that the thread is waiting for CPU.
a. SQL Server worker thread’s Quantum target is 4ms which means the thread(worker) Will ( is expected to) yield back to SQL Server scheduler when it exceeds 4ms and before it yields back it check if there are any other runnable threads, If there is any runnable threads then the thread which is in top of runnable list is scheduled and current thread will go to the tail of the runnable list and will get rescheduled when the other threads which are already waiting in SOS Scheduler (runnable list) finishes its execution or quantum. The time thread spends in runnable list waiting for its quantum is accounted as SOS_SCHEDULER_YIELD. You will see this type when multiple threads are waiting to get CPU cycle. Follow trouble shooting the steps mentioned This Link
Important: In SQL Server instances when there more than 1 CPU it is possible that the CPU is higher than the duration. Because CPU is sum of time spend by query in all the CPU’s when choosing a parallel whereas the duration is actual duration of the query.
What is long running query?
A query is considered to be long running query, when it spend most of its time on CPU and not waiting for some resource.
How to identify if the query is long running ?
Long running query can be identified by comparing the CPU and duration column in profiler (or) CPU and elapsed time when statistics time on is set . If the CPU and duration is close than the query is considered to be long running. If the query is long running identify where the query spend the time ,It could be for compiling or post compilation (For executing the query). compare the duration of the query with CompileTime (XML plan compile time (or) SQL Server parse and compile time when statistics time is on refer above image).
High Compile time:
Compare the duration of the query with Compile Time (XML plan compile time (or) SQL Server parse and compile time when statistics time is on).Compile time will normally be in few millisecond . Follow the below steps if you see high compile time
1. Identify if you have large token perm refer https://support.microsoft.com/kb/927396
2. Create necessary indexes and stats. Tune the query manually (or) in DTA and apply the recommendation
3. Reduce the complexity of query. Query which joins multiple tables (or) having large number of IN clause can taking a while to compile.
4. You can reduce the compile’s by using force parameterization option.
High CPU time:
Compare the duration of the query with Compile Time (XML plan compile time (or) SQL Server parse and compile time when statistics time is on). If the compile time is very low compared to the duration. Then follow the below steps.
1. Update the stats of tables and indexes used by the query (If the stats are up to date Estimated rows and estimated execution will be approximately same in execution plan .If there is huge difference stats are out dated and requires update) .
2. Identify if the query has used bad plan because of parameter sniffing (If the ParameterCompiledValue and ParameterRuntimeValue is different in XML plan). Refer THIS LINK to know more about Parameter Sniffing
3. If updating the stats and fixing the parameter sniffing doesn’t resolve the issue it is more likely optimizer is not able to create efficient plan because of lack of indexes and correct statistics. Run the query which is driving the CPU in database tuning advisor and apply the recommendations. (You will find missing index detail in xml plan but DTA is more efficient).
4. If the query which is running longer and consuming CPU is linked server query try changing the security of linked server to ensure linked server user has ddl_admin or dba/sysadmin on the remote server. More details regarding the issue in THIS LINK .
5. Ensure optimizer is not aborting early and creating bad plan. For details refer THIS LINK
6. Ensure the query which is spiking the CPU doesn’t have plan guides (xml plan will have PlanGuideDB attribute. Also sys.plan_guides will have entries) and query hints(index= or (option XXX join) or inner (Join Hint) join).
7. Ensure that SET options are not changed.
If you liked this post, do like us on Facebook at https://www.facebook.com/mssqlwiki and join our Facebook group and post your questions.
Thank you,
Karthick P.K |My Facebook Page |My Site| Blog space| Twitter
Disclaimer:
The views expressed on this website/blog are mine alone and do not reflect the views of my company. All postings on this blog are provided “AS IS” with no warranties, and confers no rights.