Debugging JavaScript with the IE Developer Tools
An interesting question was posted on one of the distribution lists today.
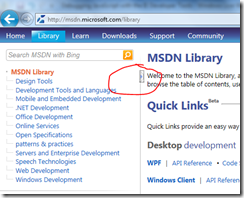
“The client wanted to look into this MSDN drag and drop typed left navigation bar to work on Sharepoint 2010, does anyone make this work or have idea about this?”
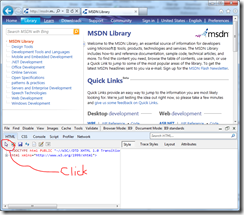
Click the control that is circled, and the menu is expanded or contracted. It’s basic JavaScript, but the more interesting part is how you can use the IE Developer Tools to inspect, format, and debug any page’s JavaScript. To use the Developer Tools in IE (introduced in IE8, I am showing IE9 in this post) press F12. Click the “Select element by click” icon, or press Ctrl + B. Then, select the item in the page that you want to inspect.
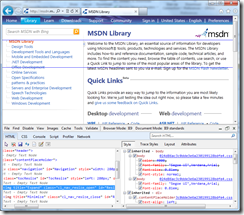
The lower pane changes to show the page source and the CSS rules that are applied, even showing which rules were overridden (very useful for figuring out CSS issues).
When we clicked the element in the page, it highlighted the following HTML for us:
 <img id="ResizeImageIncrease" class="cl_nav_resize_open"
title="Expand" onmousedown="onIncreaseToc()" alt="Expand" src="https://i3.msdn.microsoft.com/Hash/a19e30a4020fe81d2b1209058013a360.png">
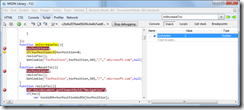
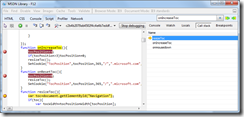
Pretty easy to see the onmousedown handler calls “onIncreaseToc()”. Let’s find that function. In the top-right of the developer tools pane, there is a search window. Switch to the Script tab and enter onIncreaseToc into the search window, and navigate through the results until you find the function declaration for onIncreaseToc.
You can see that the script is minified and somewhat unreadable. Click the Configuration toolbar item and choose “Format JavaScript”
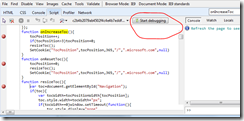
Now that the page is formatted nicely, you can easily set breakpoints in the code.
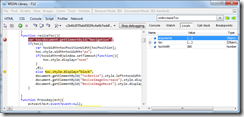
Click the Start Debugging button in the developer tools pane and watch your breakpoint get hit! You can set watches, inspect locals, and inspect the call stack.
Step through the code just like you would in Visual Studio, using F11 (step into), F10 (step over), and shift + F11 (step out).
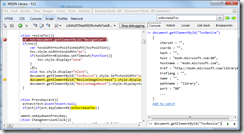
In the Console tab, you can enter script commands to inspect various elements.
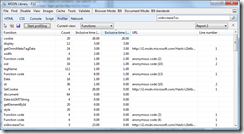
And this is just the start of what you can do with this tool. How about a great script profiling tool, built right into every instance of Internet Explorer, that profiles the performance of your script? Just go to the Profiler tab and start profiling, interact with your page, and then stop profiling to see the call results.
And the best thing is that it’s already available with every copy of Internet Explorer 8 and above, so you don’t have to install any add-ons to debug. This is extremely helpful when trying to reproduce behavior at someone’s desktop where you can’t install your favorite add-ons or debugging tools.
