Interpreting C++ Code Coverage Results
You’ve finally gotten code coverage results for your C++ code. But now your code coverage numbers are lower than you expected. Why is that? And how do you get around it?
There are several issues that make C++ code coverage data “noisy” and/or inaccurate. First, if you use the standard C++ libraries, you’ll find the code coverage results littered with entries from the std namespace, which represents classes and methods provided by Microsoft. Clearly, you don’t want library classes provided by Microsoft to impact your code coverage results. Especially if it lowers your numbers.
Another issue has to do with using template classes. Look at this example, which is a real example from some of our code:
You would probably expect this to show 100% code coverage in Visual Studio (or TFS). It doesn’t. In fact, it reports 72% code coverage. The problem is the return statement at the end. Visual Studio reports code coverage in terms of blocks covered/not covered (also this article). There are blocks in the wstring class that aren’t being covered in this method.
How do you fix this problem?
Building a Code Coverage Report
There are probably many ways to provide better code coverage numbers for C++ code. I chose to write a report for TFS that reads results from the data warehouse and process them to produce more “useful” results. Here is an overview of what the report does with the data (I’ll describe each in more detail):
- Use lines instead of blocks for coverage information
- Treat partially covered lines as covered
- Collapse concrete template instances into a “common” instance
- Use the method results with the highest coverage
- Filter out namespaces and functions
The following sections describe each of these bullets in more detail.
Use lines instead of blocks, and treat partially covered as covered
I debated a long time before making these changes. Visual Studio reports code coverage results based on block coverage, so I wasn’t sure how people would react to using lines instead. However, switching to lines and also treating partially covered lines as covered mitigates the issue I described above. It does mean we’re over-reporting coverage for lines that have conditional code, but our style guidelines call for using multiple lines in such cases, so this is probably a small issue.
Alternatively, there are Visual Studio APIs, found in the Microsoft.VisualStudio.Coverage.Analysis namespace that could be used to process the code coverage results. I haven’t tried this, and it would have taken more time than writing a report.
Collapse template instances
We have some template classes that we use as base classes. The methods are well covered with unit tests. However not all concrete instances call the base methods, and we have a number of concrete instances of these classes. The result is that we get partial code coverage multiplied by the number of concrete instances. Our desire is to know how much coverage we achieve for the code we wrote, not for compiler-generated code. As such, I chose to collapse concrete instances. For example, we have a template called BaseControl, with a concrete instance called BaseControl<ItreeView>. In the report, I collapse this into BaseControl__ so that we can “combine” the results for each base method from sub classes. This brings us to the next topic.
Use the highest coverage results
We have several different runs on our build server, and we want to combine these in the report results. For example, we have unit tests run during gated check-ins, and we runs all our automated acceptance tests nightly. The acceptance tests cover some code (such as UI code) that isn’t covered by the unit tests, and visa versa.
Because of the testing approach we’re using, the unit tests are written in C++/CLI and include the product code directly into the test DLL (see Writing Unit Tests in Visual Studio for Native C++) whereas our acceptance tests are written in C# and use the production DLL. This results in the DLL names being different between these two runs. The report I created replaces these different names with a common name so the data can be combine.
One the report collapses template instances and combined results from DLLs with different names, but representing the same code, there may be more than one record (result) for each method in the product code. How do you combine these records? TFS stores the name of the class and method, as well as lines covered, not covered, and partially covered (and also block information). I chose to use the record for each method that has the highest coverage. So if you have different test runs that cover different parts of a method, choosing the result with the highest coverage will under-report code coverage since there’s no way to tell how much overlap there is between different result records.
Filter out namespaces and functions
In my MSDN article, Agile C++ Development and Testing with Visual Studio and TFS, I talked about filtering out common patterns, such as “std::”, from the results because this represents library code that we don’t want to include. Since then, I’ve found even more patterns, so the new report I created excludes a much larger list.
Using the Results
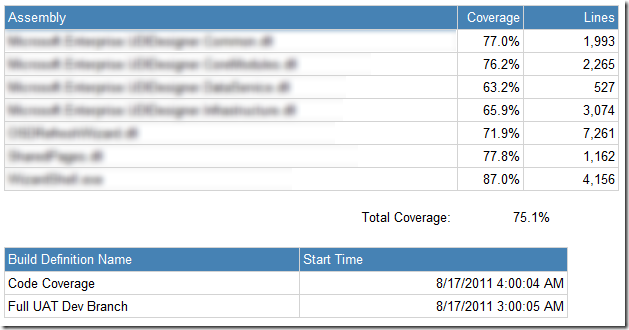
The results of all this work were very significant. Switching from block to line coverage moved our code coverage results up from 62% for one DLL to about 70%. Doing all the other work took this number up to 87%, which is more of what I expected to see since we used TDD to write all the code in that DLL.
Using the Report
If you’ve never added a new report to your reporting site, you can find some instructions here: https://blogs.msdn.com/b/aaronbjork/archive/2010/07/30/microsoft-visual-studio-scrum-1-0-updated-sprint-burndown-report.aspx.
Once you install the report in your team project, you’ll see something that looks like this:
Customizing the Report
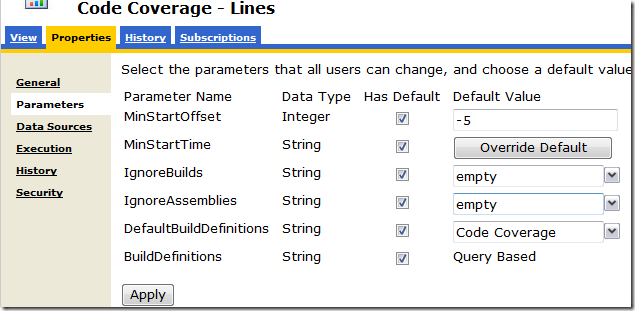
There are several places where you can customize the report. Open the report in Report Manager (right click on the Reports node in Team Explorer inside Visual Studio and select Show Report Site), click the Properties tab, then click Parameters. You’ll see something like this:
There are several hidden parameters you can use to provide more control over what you see in the report:
| MinStartOffset | The default is -5, which means the report will only show builds within the last 5 days. |
| IgnoreBuilds | A set of build definitions that you don’t want to show up in the Build Definitions parameter. I’ve used the name “empty” when there are no builds I want to ignore. |
| IgnoreAssemblies | A list of assemblies that you want to exclude from the report. This is useful to us because we have several projects that share source, so they’re all part of the same gated build definition. |
| DefaultBuildDefinitions | The list of build definitions that you want to be selected when you first run a report. |
Remember to click Apply to save changes you make to these parameters.


