Creating a Process Memory Dump
When trying to help customers debug some issues it is periodically necessary to get a memory dump (snapshot) of a process for analysis at another time or place. This is frequently the case when an error is intermittent or a live debug session is not feasible (like in a production environment). I will discuss the steps necessary to install the right debuggers, attach to the process in question, looking for the right event to occur (knowing when to save the dump) and saving a dump to disk. In this case I will be looking at BtsNtSvc.exe, which is the BizTalk NT Service process.
Installing the Debuggers
Many debuggers have support for creating (or opening) memory dumps, including Visual Studio. However, because of the size of Visual Studio and license requirements, I will discuss the use of the freely downloadable debugging tools that Microsoft provides - Debugging Tools for Windows. Make sure you install the correct version for you processor architecture (x86 vs x64).
You may want to read the Getting Started page for supplemental information. These tools come with several debuggers, most of which support the same types of operations. Windbg.exe is the GUI version, but you can also use cdb.exe (a command line based debugger) and accomplish pretty much the same things because they are built on top of the same underlying debugging libraries. In this article I will focus on WinDbg.
Setting your Symbol Path
The symbol path (path to pdb files) can be set in several ways. You can set it before you start the debugger by using the _NT_SYMBOL_PATH environment variable or at runtime. To set the symbol path at runtime, select File->Symbol File Path. This symbol path is basically just a semicolon (;) delimited list of search paths that the debugger should use when trying to locate debug symbols for the exe/dlls in your process. I will try to write more about setting up your symbol path at a later date.
You can also set the symbol path by using the .sympath command (more information below on how to run commands). See the debugger help files for more information.
Check out KB article 311503 for more information on setting symbols, including how to get publicly available symbols for microsoft products. It aslo includes a video tuturial on how to set the symbol path in the Visual Studio.Net debugger.
Attaching to the process
You can attach to the process in a couple of ways. Choose one of the following:
- From the command line you can type any of the following:
- "Windbg.exe -p <processID>" (example: "windbg.exe -p 1234")
- "windbg.exe -pn <processName>" (example: "windbg.exe -pn btsntsvc.exe")
- Note that you can add "-g" (lower case g) to any of the above to avoid breaking into the debugger immediately after attaching.
- After starting WinDbg:
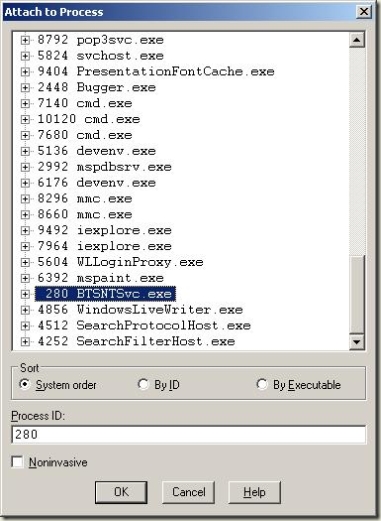
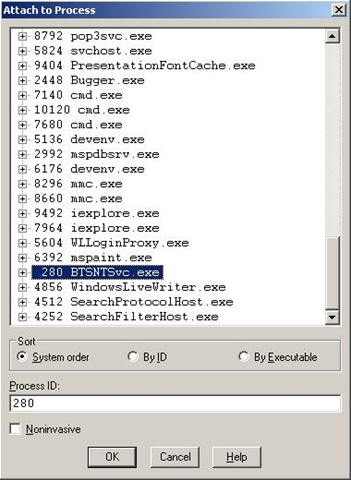
- Select File->Attach to a Process from the menu
- Select the Process from the list in the new windows that comes up
Once you have the debugger open, you can either type ".hh" in the command box or by selecting Help-> Contents from the menu. Note that you will have to break into the debugger before you can run any commands in the command box. Hit "Ctrl-Break" on your keyboard or click the pause button on the toolbar to break into the debugger.
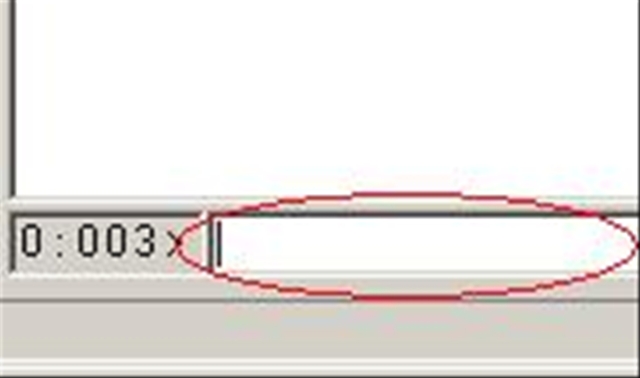
FYI, here is a snapshot of the command box (found in the lower left hand corner of the window). I have circled it in red. Note that the "0 : 003" indicates that I am currently examining thread number 3.
Looking for the right event
There may be several types of events you are interested in and several ways to locate the event you are interested in. I will only speak of three types of events in this article. Some will result in the debugger breaking for you automatically, others you will have to tell the debugger you are interested in stopping if it occurs. I will primarily focus on .NET exceptions in this article.
- Access Violation (a.k.a. AV). This type of error will result in the process breaking into the debugger without any special setup on your part. AVs occur when your program tries to access memory that it doesn't have permission to access. Examples would be reading/writing protected memory or trying to use an object that is null. In .NET, these will result in either an AccessViolationException (read/write protected memory) or NullReferenceException (null object referenced in code).
- .NET exception at the time it is thrown (a.k.a first chance exception). Windbg will not break into the debugger for this one automatically. You have to tell it that you want it to stop. You can do this by running the command sxe clr. If you need to stop breaking into the debugger every time a .NET exception is thrown, you can use the sxi clr command. Keep in mind that just because an exception is thrown does not mean that it is unexpected and unhandled. The process may expect to get exceptions in certain recoverable situations and the user may be completely unaware that anything has happened.
- .NET exception is thrown and is not handled. This will result in your process crashing. This is especially true in .NET 2.0 and later. In earlier versions of the framework, an exception being thrown and unhandled on a thread pool thread did not necessarily cause the application to shut down - it was swallowed. This made debugging applications more difficult, so in V2.0 of the framework an unhandled exception causes the application to shutdown immediately to make the system easier to debug.
Now that we know how to get the system to break into the debugger, we need to be able to look at the exception that occurred to determine if it is the one we care about. I will discuss how to do this in V2.0 of the framework. It can be done in earlier versions of the framework also, but it isn't quite as easy.
Because Windbg is primarily a native application debugging tool, you have to load what is called a debugger extension to enable you to debug managed code. This extension is called sos.dll and it sits in the .net framework installation directory. You can use one of the following commands to easily load it without having to type the full path:
.Net Framework 3.5 or earlier: .loadby sos mscorwks
.Net Framework 4.0: .loadby sos clr
This tells windbg to look in the same directory as mscorwks.dll or clr.dll (always loaded into .NET applications) to find sos.dll. Commands that are loaded from a debugger extension dll are always prefixed with an exclamation mark (!).
When you have sos.dll loaded you can run !help. Note that if you have multiple extensions loaded, you may have to prefix your commands with the specific extension that has the command you want. For example: !sos.help.
Now, when the debugger breaks, we can do run two commands to help us figure out where we are and what type of exception occured. !sos.printexception (or !pe is the shorthand version) and !clrstack. If the exception type, message and stack trace match the one you see in logs, event viewer, etc., then you have (hopefully) found the right exception.
Here is some sample output when a first chance .NET exception occurs:
(650.1c9c): CLR exception - code e0434f4d (first chance)
First chance exceptions are reported before any exception handling.
This exception may be expected and handled.
eax=0012f298 ebx=00181a60 ecx=00000000 edx=00000025 esi=0012f324 edi=e0434f4d
eip=77e55e02 esp=0012f294 ebp=0012f2e8 iopl=0 nv up ei pl nz na po nc
cs=001b ss=0023 ds=0023 es=0023 fs=003b gs=0000 efl=00000202
KERNEL32!RaiseException+0x53:
77e55e02 5e pop esi
0:000> !pe
Exception object: 01355858
Exception type: System.InvalidOperationException
Message: This is a sample exception message for an InvalidOperationException
InnerException: <none>
StackTrace (generated):
<none>
StackTraceString: <none>
HResult: 80131509
0:000> !clrstack
OS Thread Id: 0x1c9c (0)
ESP EIP
0012f370 77e55e02 [HelperMethodFrame: 0012f370]
0012f414 00d8021e Test.AnotherFunctionThatThrowsAnException(System.String)
0012f420 00d801c2 Test.SomeFunction()
0012f428 00d800b2 Test.Main()
0012f69c 79e88f63 [GCFrame: 0012f69c]
If the exception you are currently looking at is not the one you were looking for, then you can tell the debugger to let the process continue until the next event by using the g command (go). Of course, these debuggers support break points also, but that is a discussion for another day.
Saving the Dump File
Now that you have the process broken into the debugger at the right place, you can use .dump command to write the memory dump out to a file.
.dump <options> <path to file>
example: .dump /ma c:\temp\myDump.dmp
I would recommend the /ma options for this command as I show above. You can read the help files for the .dump command to get more information on the options you can use and what they imply.
Just a reminder...
One last warning about memory dumps before we are done. Memory dumps contain the memory snapshot of the process. This memory can contain private information that you and/or your customers wouldn't want to give out to just anyone. Some examples: usernames and passwords, credit card numbers, etc - anything that is in memory at the time the dump is taken. Consider yourself warned - don't give a copy of the memory dump to just anyone.