Office webb komponents i Microsoft CRM 3.0 (level 300)
I office finns det ett bra bibliotek för att programmera
staplar och diagram precis som man kan göra ifrån tex Excel. Hur gör man då? Jag tänkte inte publicera en hel solution
utan mera några exempel på möjligheter. Tex kan man relativt enkelt göra om detta för att visa
i en Vista Gadget.
1.
Ladda ner office webb komponents till din applikations server (Jag har
testat med owc11.exe) Har ännu inte hunnit med nya office.
2.
Bygg din wraper för webb komponents (se exempel
nedan)
3.
Skapa din egen webb
a la CRM 3.0 GUI
4.
Peka till din “office charts
webb”
·
Från sitemap
·
Från iframe ifrån din entitet eller Vista Gadget
·
Från Outlook
folder
·
Från Sharepoint webbpart
Möjligheterna är
oändliga! Dock innebär detta lite mera utveckling men resultatet kommer bli så
grymt så det är värt mödan J
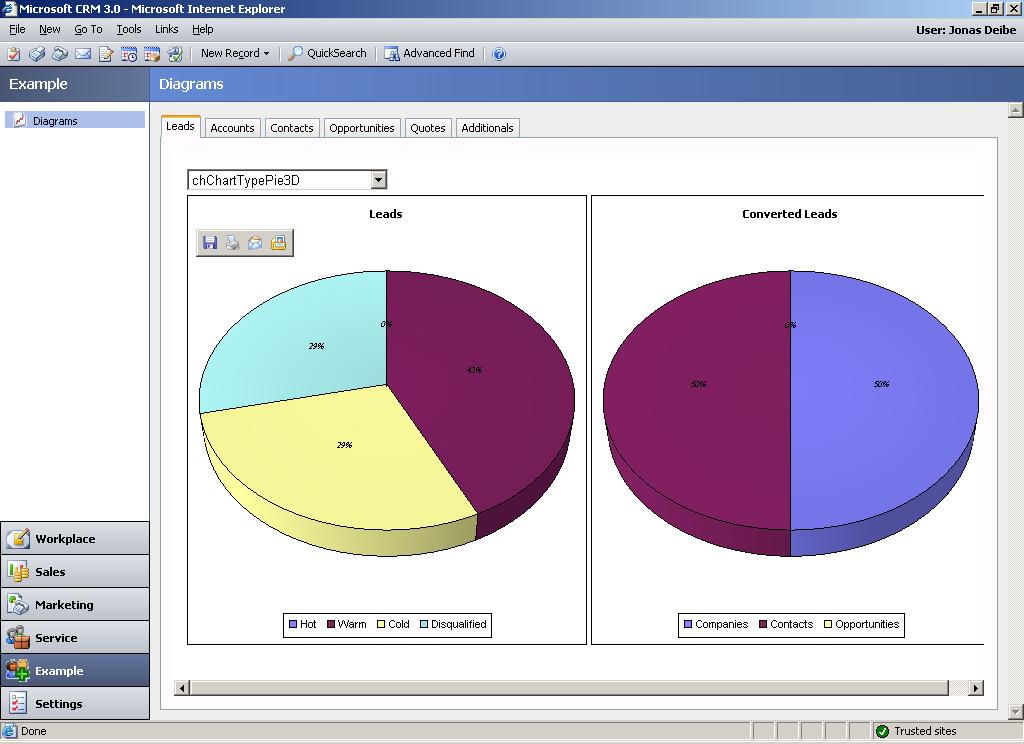
Har en aspx fil som innehåller tabbar som i sin tur pekar på varje
chart renderad från sin egen aspx (via en http handler för
själva bilden som genereras på servern via office webb
components). Det är lite mera kod bakom denna lösning
bla så publicerar jag inte logiken för att fråga
databasen om vad som ska visas men det är inte svårt att göra
själv.
Exemple på leadsbyquality.aspx
namespace Example.Crm.Web.Charts
{
public class ChartLeadByQuality : System.Web.UI.Page
{
protected System.Web.UI.WebControls.DropDownList myChartType;
protected System.Web.UI.WebControls.Image imgChartLead;
protected System.Web.UI.WebControls.Image imgChartLeadByEntity;
protected void Page_Load(object sender, System.EventArgs e)
{
DisplayChart();
}
void DisplayChart()
{
try
{
CrmLead Leads = new CrmLead("result");
Leads.Refresh();
//Leads by type
int items = Leads.DataSet.Tables["LeadsByQuality"].Rows.Count;
string[] LeadCategoriesArr = new string[items];
string[] LeadValuesArr = new string[items];
int i = 0;
foreach (DataRow r in Leads.DataSet.Tables["LeadsByQuality"].Rows)
{
LeadCategoriesArr[i] = r["Quality-Code"].ToString();
LeadValuesArr[i] = r["Leads"].ToString();
i++;
System.Diagnostics.Debug.WriteLine(r["Leads"].ToString());
}
//Leads by Entity
items = Leads.DataSet.Tables["LeadsByEntity"].Rows.Count;
string[] LeadByEntityCategoriesArr = new string[items];
string[] LeadByEntityValuesArr = new string[items];
i = 0;
foreach (DataRow r in Leads.DataSet.Tables["LeadsByEntity"].Rows)
{
LeadByEntityCategoriesArr[i] = r["Entity-Type"].ToString();
LeadByEntityValuesArr[i] = r["Leads"].ToString();
i++;
System.Diagnostics.Debug.WriteLine(r["Leads"].ToString());
}
//Render charts to webbrowser
RenderChart chart = new RenderChart();
chart.Title = "Leads";
chart.SizeX = 200;
chart.SizeY = 250;
HttpContext ctx = HttpContext.Current;
string chartID = Guid.NewGuid().ToString();
//Leads by status
byte[] byteArrLeads = chart.BuildCharts
( myChartType.SelectedItem.Value,
LeadCategoriesArr, LeadValuesArr);
ctx.Session [chartID] = byteArrLeads;
imgChartLead.ImageUrl = string.Concat ("Chart.ashx?", chartID);
//Leads converted to account, Contact or opportunities
chart.Title = "Converted Leads";
byte[] byteArrLeadsByEntity = chart.BuildCharts
( myChartType.SelectedItem.Value,
LeadByEntityCategoriesArr, LeadByEntityValuesArr);
chartID = Guid.NewGuid().ToString();
ctx.Session [chartID] = byteArrLeadsByEntity;
imgChartLeadByEntity.ImageUrl = string.Concat ("Chart.ashx?", chartID);
}
catch (System.Web.Services.Protocols.SoapException err)
{
string ErrorMsg = String.Concat("ErrorMessage: ", err.Message, " ", err.InnerException, " Source: ", err.Source);
Response.Write(ErrorMsg);
}
catch (Exception err)
{
string ErrorMsg = string.Concat("ErrorMessage: ", err.Message, " ", err.InnerException, " Source: ", err.Source);
Response.Write(ErrorMsg);
}
}
Exemple
på Office wrapper (sista lagret)
Chart.ashx (http handler)
<% @ WebHandler language="C#" class="Example.Crm.Web.BiCharts.ChartHandler" codebehind="ChartHandler.cs" %>
Som i sin tur
pekar på min assembly (med ref till Office webb
komponents interop)
 //
Jonas Deibe example
using System;
using System.Collections;
using OWC11;
namespace Example.Web.Charts
{
/// <summary>
/// POC for Diagrams
/// </summary>
public class RenderChart
{
void debug(string message)
{
System.Diagnostics.Debug.WriteLine(message);
}
int _SizeX = 0;
int _SizeY = 0;
string _Title = string.Empty;
string _Font = "Tahoma";
public string Font
{
set { _Font = value; }
get { return _Font; }
}
public string Title
{
set { _Title = value; }
get { return _Title; }
}
public int SizeY
{
set { _SizeY = value; }
get { return _SizeY; }
}
public int SizeX
{
set { _SizeX = value; }
get { return _SizeX; }
}
public RenderChart()
{
}
~RenderChart()
{
}
public byte[] BuildCharts (string ChartType, ArrayList Categories, ArrayList Values )
{
string chartCategoriesStr = string.Join("\t", (string []) Categories.ToArray(typeof(string)));
string chartValuesStr = string.Join("\t", (string[]) Values.ToArray(typeof(string)));
return createChartNormal(ChartType, chartCategoriesStr, chartValuesStr);
}
public byte[] BuildCharts (string ChartType, string[] Categories, string[] Values)
{
string chartCategoriesStr = String.Join ("\t", Categories);
string chartValuesStr = String.Join ("\t", Values);
return createChartNormal(ChartType, chartCategoriesStr, chartValuesStr);
}
public byte[] createChartOppByRevenue(string ChartType, ArrayList Categories, ArrayList PValues, ArrayList WValues, ArrayList QuoteValues)
{
string chartCategoriesStr = string.Join("\t", (string []) Categories.ToArray(typeof(string)));
string chartPValuesStr = string.Join("\t", (string[]) PValues.ToArray(typeof(string)));
string chartWValuesStr = string.Join("\t", (string[]) WValues.ToArray(typeof(string)));
string chartQuoteAmount = string.Join("\t", (string[]) QuoteValues.ToArray(typeof(string)));
debug(chartPValuesStr);
debug(chartCategoriesStr);
ChartSpaceClass oChartSpace = new ChartSpaceClass ();
ChartChartTypeEnum chartType;
switch (ChartType)
{
case "1":
chartType = ChartChartTypeEnum.chChartTypeArea;
break;
case "2":
chartType = ChartChartTypeEnum.chChartTypeArea3D;
break;
case "3":
chartType = ChartChartTypeEnum.chChartTypeBarClustered;
break;
case "4":
chartType = ChartChartTypeEnum.chChartTypeBar3D;
break;
case "5":
chartType = ChartChartTypeEnum.chChartTypeColumnClustered;
break;
case "6":
chartType = ChartChartTypeEnum.chChartTypeColumn3D;
break;
case "7":
chartType = ChartChartTypeEnum.chChartTypeDoughnut;
break;
case "8":
chartType = ChartChartTypeEnum.chChartTypeLineStacked;
break;
case "9":
chartType = ChartChartTypeEnum.chChartTypeLine3D;
break;
case "10":
chartType = ChartChartTypeEnum.chChartTypeLineMarkers;
break;
case "11":
chartType = ChartChartTypeEnum.chChartTypePie;
break;
case "12":
chartType = ChartChartTypeEnum.chChartTypePie3D;
break;
case "13":
chartType = ChartChartTypeEnum.chChartTypeRadarSmoothLine;
break;
case "14":
chartType = ChartChartTypeEnum.chChartTypeSmoothLine;
break;
default:
chartType = ChartChartTypeEnum.chChartTypeColumn3D;
break;
}
if (chartType == ChartChartTypeEnum.chChartTypePie ||
chartType == ChartChartTypeEnum.chChartTypePie3D ||
chartType == ChartChartTypeEnum.chChartTypeDoughnut)
{
oChartSpace.HasChartSpaceLegend = true;
oChartSpace.ChartSpaceLegend.Position = ChartLegendPositionEnum.chLegendPositionBottom;
}
oChartSpace.Border.Color = "black";
oChartSpace.Charts.Add(0);
oChartSpace.Charts[0].HasTitle = true;
oChartSpace.Charts[0].Type = chartType;
oChartSpace.Charts[0].ChartDepth = 130;
oChartSpace.Charts[0].AspectRatio = 30;
oChartSpace.Charts[0].Title.Caption = this.Title;
oChartSpace.Charts[0].Title.Font.Name = this.Font;
oChartSpace.Charts[0].Title.Font.Size = 8;
oChartSpace.Charts[0].Title.Font.Bold = true;
oChartSpace.Charts[0].HasLegend = true;
//How many items you need per column.
for (int i = 0; i < 3; i++)
{
oChartSpace.Charts[0].SeriesCollection.Add(i);
oChartSpace.Charts[0].SeriesCollection[i].DataLabelsCollection.Add ();
}
if (chartType == ChartChartTypeEnum.chChartTypePie ||
chartType == ChartChartTypeEnum.chChartTypePie3D ||
chartType == ChartChartTypeEnum.chChartTypeDoughnut)
{
oChartSpace.Charts[0].SeriesCollection[0].DataLabelsCollection[0].HasPercentage = true;
oChartSpace.Charts[0].SeriesCollection[0].DataLabelsCollection[0].HasValue = false;
oChartSpace.Charts[0].SeriesCollection[1].DataLabelsCollection[0].HasPercentage = true;
oChartSpace.Charts[0].SeriesCollection[1].DataLabelsCollection[0].HasValue = false;
oChartSpace.Charts[0].SeriesCollection[2].DataLabelsCollection[0].HasPercentage = true;
oChartSpace.Charts[0].SeriesCollection[2].DataLabelsCollection[0].HasValue = false;
}
else
{
oChartSpace.Charts[0].Axes[0].MajorUnit = 500000;
oChartSpace.Charts[0].Axes[1].MajorUnit = 500000;
//oChartSpace.Charts[0].Axes[2].MajorUnit = 100000;
oChartSpace.Charts[0].SeriesCollection[0].DataLabelsCollection[0].HasPercentage = false;
oChartSpace.Charts[0].SeriesCollection[0].DataLabelsCollection[0].HasValue = false;
oChartSpace.Charts[0].SeriesCollection[1].DataLabelsCollection[0].HasPercentage = false;
oChartSpace.Charts[0].SeriesCollection[1].DataLabelsCollection[0].HasValue = false;
oChartSpace.Charts[0].SeriesCollection[2].DataLabelsCollection[0].HasPercentage = false;
oChartSpace.Charts[0].SeriesCollection[2].DataLabelsCollection[0].HasValue = false;
}
//set data to chart
//oChartSpace.Charts[0].SeriesCollection[0].Caption = "Intäkt";
oChartSpace.Charts[0].SeriesCollection[0].Caption = "Potentional revenue";
oChartSpace.Charts[0].SeriesCollection[0].SetData (ChartDimensionsEnum.chDimCategories, Convert.ToInt32(ChartSpecialDataSourcesEnum.chDataLiteral), chartCategoriesStr);
oChartSpace.Charts[0].SeriesCollection[0].SetData (ChartDimensionsEnum.chDimValues, Convert.ToInt32(ChartSpecialDataSourcesEnum.chDataLiteral), chartPValuesStr);
oChartSpace.Charts[0].SeriesCollection[0].Interior.SetTwoColorGradient(ChartGradientStyleEnum.chGradientDiagonalDown, ChartGradientVariantEnum.chGradientVariantCenter, "Blue", "Silver");
//oChartSpace.Charts[0].SeriesCollection[1].Caption = "Viktad intäkt";
oChartSpace.Charts[0].SeriesCollection[1].Caption = "Weighted revenue";
oChartSpace.Charts[0].SeriesCollection[1].SetData(ChartDimensionsEnum.chDimCategories, Convert.ToInt32(ChartSpecialDataSourcesEnum.chDataLiteral), chartCategoriesStr);
oChartSpace.Charts[0].SeriesCollection[1].SetData(ChartDimensionsEnum.chDimValues, Convert.ToInt32(ChartSpecialDataSourcesEnum.chDataLiteral), chartWValuesStr);
oChartSpace.Charts[0].SeriesCollection[1].Interior.SetOneColorGradient(ChartGradientStyleEnum.chGradientDiagonalDown, ChartGradientVariantEnum.chGradientVariantCenter, 1, "Green");
//oChartSpace.Charts[0].SeriesCollection[2].Caption = "Aktiva offerter";
oChartSpace.Charts[0].SeriesCollection[2].Caption = "Active quotes";
oChartSpace.Charts[0].SeriesCollection[2].SetData(ChartDimensionsEnum.chDimCategories, Convert.ToInt32(ChartSpecialDataSourcesEnum.chDataLiteral), chartCategoriesStr);
oChartSpace.Charts[0].SeriesCollection[2].SetData(ChartDimensionsEnum.chDimValues, Convert.ToInt32(ChartSpecialDataSourcesEnum.chDataLiteral), chartQuoteAmount);
oChartSpace.Charts[0].SeriesCollection[2].Interior.SetOneColorGradient(ChartGradientStyleEnum.chGradientDiagonalDown, ChartGradientVariantEnum.chGradientVariantCenter, 1, "Black");
byte[] byteArr = (byte[]) oChartSpace.GetPicture ("png", this.SizeX, this.SizeY);
return byteArr;
}
byte[] createChartNormal(string ChartType, string chartCategoriesStr, string chartValuesStr)
{
ChartSpaceClass oChartSpace = new ChartSpaceClass ();
ChartChartTypeEnum chartType;
switch (ChartType)
{
case "1":
chartType = ChartChartTypeEnum.chChartTypeArea;
break;
case "2":
chartType = ChartChartTypeEnum.chChartTypeArea3D;
break;
case "3":
chartType = ChartChartTypeEnum.chChartTypeBarClustered;
break;
case "4":
chartType = ChartChartTypeEnum.chChartTypeBar3D;
break;
case "5":
chartType = ChartChartTypeEnum.chChartTypeColumnClustered;
break;
case "6":
chartType = ChartChartTypeEnum.chChartTypeColumn3D;
break;
case "7":
chartType = ChartChartTypeEnum.chChartTypeDoughnut;
break;
case "8":
chartType = ChartChartTypeEnum.chChartTypeLineStacked;
break;
case "9":
chartType = ChartChartTypeEnum.chChartTypeLine3D;
break;
case "10":
chartType = ChartChartTypeEnum.chChartTypeLineMarkers;
break;
case "11":
chartType = ChartChartTypeEnum.chChartTypePie;
break;
case "12":
chartType = ChartChartTypeEnum.chChartTypePie3D;
break;
case "13":
chartType = ChartChartTypeEnum.chChartTypeRadarSmoothLine;
break;
case "14":
chartType = ChartChartTypeEnum.chChartTypeSmoothLine;
break;
default:
chartType = ChartChartTypeEnum.chChartTypeColumn3D;
break;
}
if (chartType == ChartChartTypeEnum.chChartTypePie ||
chartType == ChartChartTypeEnum.chChartTypePie3D ||
chartType == ChartChartTypeEnum.chChartTypeDoughnut)
{
oChartSpace.HasChartSpaceLegend = true;
oChartSpace.ChartSpaceLegend.Position = ChartLegendPositionEnum.chLegendPositionBottom;
}
oChartSpace.Border.Color = "black";
oChartSpace.Charts.Add(0);
oChartSpace.Charts[0].HasTitle = true;
oChartSpace.Charts[0].Type = chartType;
oChartSpace.Charts[0].ChartDepth = 130;
oChartSpace.Charts[0].AspectRatio = 30;
oChartSpace.Charts[0].Title.Caption = this.Title;
oChartSpace.Charts[0].Title.Font.Name = this.Font;
oChartSpace.Charts[0].Title.Font.Size = 8;
oChartSpace.Charts[0].Title.Font.Bold = true;
oChartSpace.Charts[0].SeriesCollection.Add(0);
oChartSpace.Charts[0].SeriesCollection[0].DataLabelsCollection.Add ();
if (chartType == ChartChartTypeEnum.chChartTypePie ||
chartType == ChartChartTypeEnum.chChartTypePie3D ||
chartType == ChartChartTypeEnum.chChartTypeDoughnut)
{
oChartSpace.Charts[0].SeriesCollection[0].DataLabelsCollection[0].HasPercentage = true;
oChartSpace.Charts[0].SeriesCollection[0].DataLabelsCollection[0].HasValue = false;
}
else
{
oChartSpace.Charts[0].SeriesCollection[0].DataLabelsCollection[0].HasPercentage = false;
oChartSpace.Charts[0].SeriesCollection[0].DataLabelsCollection[0].HasValue = true;
}
oChartSpace.Charts[0].SeriesCollection[0].Caption = string.Empty;
oChartSpace.Charts[0].SeriesCollection[0].DataLabelsCollection[0].Font.Name = this._Font;
oChartSpace.Charts[0].SeriesCollection[0].DataLabelsCollection[0].Font.Size = 6;
oChartSpace.Charts[0].SeriesCollection[0].DataLabelsCollection[0].Font.Italic = true;
oChartSpace.Charts[0].SeriesCollection[0].DataLabelsCollection[0].Font.Color = "black";
oChartSpace.Charts[0].SeriesCollection[0].DataLabelsCollection[0].Position = ChartDataLabelPositionEnum.chLabelPositionCenter;
oChartSpace.Charts[0].SeriesCollection[0].SetData (ChartDimensionsEnum.chDimCategories, Convert.ToInt32(ChartSpecialDataSourcesEnum.chDataLiteral), chartCategoriesStr);
oChartSpace.Charts[0].SeriesCollection[0].SetData (ChartDimensionsEnum.chDimValues, Convert.ToInt32(ChartSpecialDataSourcesEnum.chDataLiteral), chartValuesStr);
//oChartSpace.Charts[0].SeriesCollection[0].Interior.SetTwoColorGradient(ChartGradientStyleEnum.chGradientDiagonalDown, ChartGradientVariantEnum.chGradientVariantCenter, "Blue", "Silver");
//oChartSpace.Charts[0].SeriesCollection[0].DataLabelsCollection[0].NumberFormat = "0.00";
byte[] byteArr = (byte[]) oChartSpace.GetPicture ("png", this.SizeX, this.SizeY);
return byteArr;
// HttpContext ctx = HttpContext.Current;
// string chartID = Guid.NewGuid ().ToString ();
//
// ctx.Session [chartID] = byteArr;
// imgChart.ImageUrl = string.Concat ("Chart.ashx?", chartID);
}
}
}