Using SQL Server to Analyze Analysis Services Profiler Traces
In 2007, Carl Rabeler and Eric Jacobsen wrote a fairly detailed white paper entitled Identifying and Resolving MDX Query Performance Bottlenecks in SQL Server 2005 Analysis Services (https://www.microsoft.com/en-us/download/details.aspx?id=661). In that white paper, they describe a method of determining if the bottleneck is in Storage Engine or Formula Engine that involves adding the elapsed time for each Query Subcube event in a SQL Server Profiler trace. What the white paper doesn't explicitly state is that determining the amount of time spent in Storage Engine involves adding up the elapsed time for each Query Subcube event that is associated with a particular ConnectionID and a particular Query. One approach to analyzing SQL Server Profiler Traces captured from an Analysis Services Server has been to first save the trace to a SQL Server table and then execute a series of SQL queries similar to the following:
-- First get a list of the Query End events ordered by duration in descending order
SELECT ROWNUMBER, EVENTCLASS, EVENTSUBCLASS, TEXTDATA, CONNECTIONID, DURATION FROM <TABLE_NAME> WHERE EVENTCLASS=10 ORDER BY DURATION DESC
-- Note the ConnectionID and Rownumber of the Long running Query so that we can get the RowNumber for the corresponding Query Begin events
SELECT TOP 2 ROWNUMBER, EVENTCLASS, EVENTSUBCLASS, TEXTDATA, CONNECTIONID, DURATION FROM <TABLE_NAME>
WHERE EVENTCLASS IN (9,10) AND CONNECTIONID=<IDENTIFIED_CONNECTIONID> AND ROWNUMBER<=<ROWNUMBER_OF_LONG_RUNNING_QUERY>
ORDER BY ROWNUMBER DESC
-- Note the RowNumber of the Query Begin event and then sum the durations for the Query Subcube events for the specific query that was executed on a specific connection
SELECT SUM(DURATION) AS SE_TIME FROM <TABLE_NAME> WHERE EVENTCLASS=11 AND CONNECTIONID=<IDENTIFIED_CONNECTIONID>
AND ROWNUMBER BETWEEN <QUERY_BEGIN_ROWNUMBER> AND <QUERY_END_ROWNUMBER>
The resulting set of queries starts to look something like the following:
select rownumber, eventclass, eventsubclass, textdata, connectionid, duration, starttime, currenttime from MYTABLE where EventClass=10 order by duration desc
select top 2 rownumber, eventclass, eventsubclass, textdata, connectionid, duration, starttime, currenttime from MYTABLE where
EventClass in (9,10) and ConnectionID=398 and RowNumber <=12280 order by RowNumber desc
select SUM(duration) as SE_TIME from MYTABLE where EventClass=11 and ConnectionID=398 and RowNumber between 11800 and 12280
You can then use the rule of thumb that any query where the value returned for SE_TIME exceeds 30% of the query duration is bottlenecked in Storage Engine. It's a great methodology for quickly identifying where performance issues reside in an MDX query. This methodology however, assumes that the person doing the analysis knows that EventClass 9 is the Query Begin event, EventClass 10 is the Query End event, and EventClass 11 is the Query Subcube event.
The approach described above, however, has a couple of pitfalls.
1. If there are large numbers of "long running" MDX queries captured in the Profiler trace, execution of a large number of SQL queries becomes necessary
2. This approach is only useful for examining bottlenecks in MDX queries and can't really be used to analyze processing performance bottlenecks, because a substantial amount of work is done in parallel.
With those limitations in mind, I decided to fall back on a background in statistics and try a somewhat different approach that involves a bit of SQL Algebra. The first thing I wanted to do was build a clean SQL Server database that would contain the data from Profiler traces on which I wanted to perform analyses. Pretty simple task, just launch good old SSMS and execute the following SQL commands:
CREATE DATABASE OLAPANALYSIS
GO
USE OLAPANALYSIS
GO
So now I've got a database to store my data in but I want to do more than just analyze performance issues involving MDX queries. I also want to be able to analyze processing performance issues, which means that I need to know all of the different EventClass and EventSubclass codes represent. Because I really have no greate burning urgent desire to memorize close to 400 numeric codes, I'm just going to use a bit of XQuery magic and import the data from the Trace Definition XML file into a pair of tables using the following SQL statements:
CREATE TABLE ProfilerEventClass (EventClassID int not null, Name nvarchar(50),Description nvarchar(500))
GO
-- Since I'm using my Denali instance of SQL Server 2012 Analysis Services, I'm going to use the trace
-- definition file that's located in the bin\Resoureces\1033 sub-directory for US English
declare @xml as XML
SELECT @xml = x.y
FROM OPENROWSET( BULK 'C:\Program Files\Microsoft SQL Server\MSAS11.DENALI\OLAP\bin\Resources\1033\tracedefinition110.xml', SINGLE_CLOB ) x(y)
insert into ProfilerEventClass(EventclassID, Name, Description)
select c.c.value('(ID/text())[1]','INT')EventClassID,
c.c.value('(NAME/text())[1]','VARCHAR(50)')Name,
c.c.value('(DESCRIPTION/text())[1]','VARCHAR(500)')Description
from @xml.nodes('TRACEDEFINITION/EVENTCATEGORYLIST/EVENTCATEGORY/EVENTLIST/EVENT') as c(c)
GO
CREATE TABLE ProfilerEventSubclass (EventClassID int not null, EventSubclassID int not null, Name nvarchar(50))
GO
declare @xml as XML
SELECT @xml = x.y
FROM OPENROWSET( BULK 'C:\Program Files\Microsoft SQL Server\MSAS11.DENALI\OLAP\bin\Resources\1033\tracedefinition110.xml', SINGLE_CLOB ) x(y)
insert into ProfilerEventSubclass(EventClassID, EventSubclassID, Name)
select c.c.value('(../../../../ID/text())[1]','INT')EventClassID,
c.c.value('(ID/text())[1]','INT')EventSubClassID,
c.c.value('(NAME/text())[1]','VARCHAR(50)')Name
from @xml.nodes('TRACEDEFINITION/EVENTCATEGORYLIST/EVENTCATEGORY/EVENTLIST/EVENT/EVENTCOLUMNLIST/EVENTCOLUMN/EVENTCOLUMNSUBCLASSLIST/EVENTCOLUMNSUBCLASS') as c(c)
GO
So now I've got a complete set of the EventClass and EventSubclass codes as well as the Names associated with each. Now I can save my Profiler trace to a table and start to perform some analyses, but since the profiler trace I'm interested in contains close to 1000 long running MDX queries in addition to some processing operations I really don't care to spend several hours executing multiple SQL queries to determine the bottleneck for each of those long running queries. That means it's time for a little bit of CTE and some correlated SQL queries with a bit of a twist. The twist, in this case is that I'm going to calculate a Z Score so that I can look at the duration data on the basis of how much it deviates from the average duration for a given event.
with ProcAnalysis (Rownumber, EventClass, EventSubClass, TextData, QueryDuration, SETime, MinRow, Bottleneck, ConnectionID, ZScore)
AS
(
select a.Rownumber, pec.name as EventClass, pes.name as EventSubclass, cast(a.TextData as nvarchar(max)) as TextData, a.duration,
(select sum(duration) from changinddims b where b.eventclass=11 and b.connectionID=a.ConnectionID and b.rownumber between
(select max(rownumber) from changinddims c where c.eventclass=9 and c.rownumber<a.rownumber and c.connectionid=a.connectionid) and a.rownumber) as SETime,
(select max(rownumber) from changinddims c where c.eventclass=9 and c.rownumber<a.rownumber) as MinRow,
case when (select sum(duration) from changinddims b where b.eventclass=11 and b.connectionID=a.ConnectionID and b.rownumber between
(select max(rownumber) from changinddims c where c.eventclass=9 and c.rownumber<a.rownumber and c.connectionid=a.connectionid) and a.rownumber)>a.duration*.3 then 'Storage Engine'
else
'Formula Engine'
end as Bottleneck,
a.ConnectionID,
case when (select stdev(b.duration) from changinddims b where a.eventclass = b.eventclass and a.eventsubclass=b.eventsubclass and duration is not null) = 0
or (select avg(b.duration) from changinddims b where a.eventclass = b.eventclass and a.eventsubclass=b.eventsubclass and duration is not null)=0 then 0
else
(a.duration-(select avg(b.duration) from changinddims b where a.eventclass = b.eventclass and a.eventsubclass=b.eventsubclass and duration is not null))/(select stdev(b.duration) from changinddims b where a.eventclass = b.eventclass and a.eventsubclass=b.eventsubclass and duration is not null)
end
as ZScore
from changinddims a
inner join OlapAnalysis.dbo.ProfilerEventClass pec on a.EventClass=pec.EventClassID
inner join OlapAnalysis.dbo.ProfilerEventSubclass pes on a.EventClass=pes.EventClassID
and a.EventSubclass=pes.EventSubClassID
)
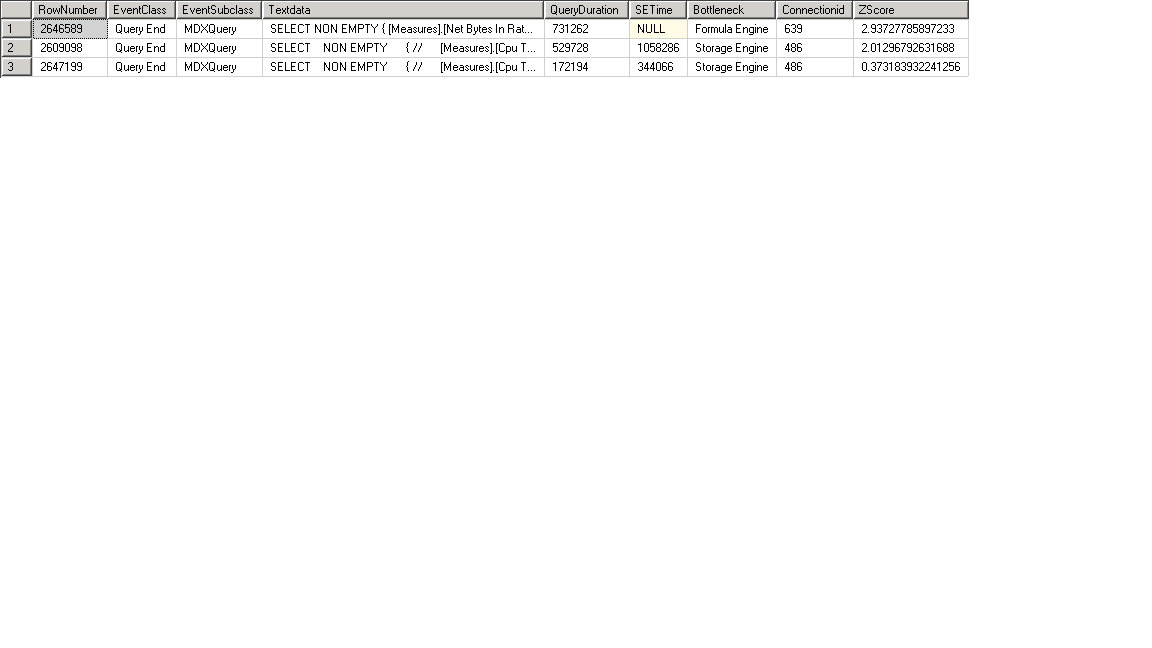
select RowNumber, EventClass, EventSubclass, Textdata, QueryDuration, SETime, MinRow, Bottleneck, Connectionid, ZScore
From ProcAnalysis
where EventClass = 'Query End'
-- To look at queries the 50% of queries that are above average, use a Z Score value of 0
-- To look at the top 32% of long running queries, use a Z Score value of 1
and cast(zscore as float)>0
order by queryduration desc, ZScore desc
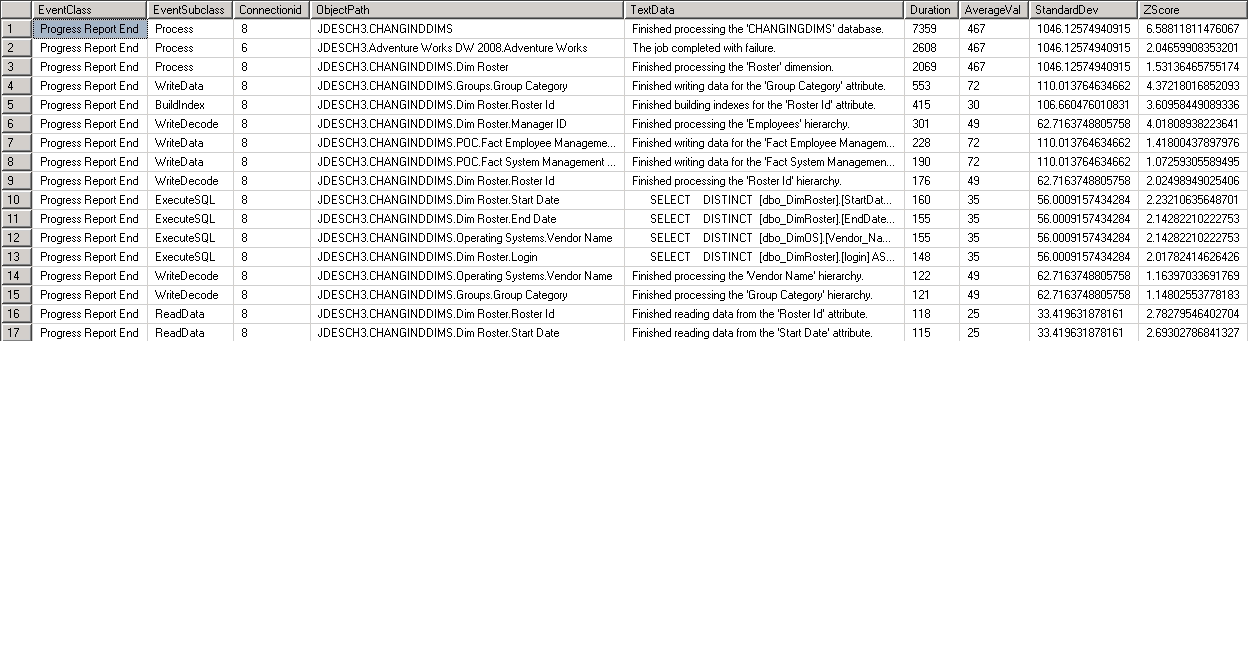
But now I want to take a look at some issues related to processing operations using a variant of the same methodology. Again using a CTE query with correlated sub-queries, I'm simply going to execute the following SQL statement:
with ProcAnalysis (EventClass, EventSubClass, ConnectionID, ObjectPath, TextData, Duration, AverageVal, StandardDev, ZScore)
AS
(
select pec.name as EventClass, pes.name as EventSubclass, a.ConnectionID, a.ObjectPath, cast(a.TextData as nvarchar(max)) as TextData, a.duration,
(select avg(b.duration) from changinddims b where a.eventclass = b.eventclass and a.eventsubclass=b.eventsubclass and duration is not null) as avgval,
(select stdev(b.duration) from changinddims b where a.eventclass = b.eventclass and a.eventsubclass=b.eventsubclass and duration is not null) as stddeval,
case when (select stdev(b.duration) from changinddims b where a.eventclass = b.eventclass and a.eventsubclass=b.eventsubclass and duration is not null) = 0
or (select avg(b.duration) from changinddims b where a.eventclass = b.eventclass and a.eventsubclass=b.eventsubclass and duration is not null)=0 then 0
else
-- Calculate a Z Score to determine deviation from the mean
(a.duration-(select avg(b.duration) from changinddims b
where a.eventclass = b.eventclass and a.eventsubclass=b.eventsubclass and duration is not null))
/(select stdev(b.duration) from changinddims b where a.eventclass = b.eventclass and a.eventsubclass=b.eventsubclass and duration is not null)
end
as ZScore
from changinddims a
inner join OlapAnalysis.dbo.ProfilerEventClass pec on a.EventClass=pec.EventClassID
inner join OlapAnalysis.dbo.ProfilerEventSubclass pes on a.EventClass=pes.EventClassID
and a.EventSubclass=pes.EventSubClassID
)
select EventClass, EventSubclass, Connectionid, ObjectPath, TextData, Duration, AverageVal, StandardDev, ZScore
From ProcAnalysis
where EventClass != 'Notification' and duration is not null and duration < (select max(duration) from ProcAnalysis)
-- To look at the top 50% of long running operations, use a Z Score value of 0
-- To look at the top 32% of long running operations, use a Z Score value of 1
and cast(zscore as float)>1
order by duration desc, ZScore desc
That query returns the following data set: