Using IntelliTrace to debug Windows Azure Cloud Services
One of the cool new features of the June 2010 Windows Azure Tools + SDK is the integration of IntelliTrace to allow you to debug issues that occur in the cloud.
IntelliTrace support requires .NET 4, Visual Studio 2010 Ultimate and the cloud service has to be deployed with IntelliTrace enabled. If you are using a 32-Bit OS, you need this patch/QFE.
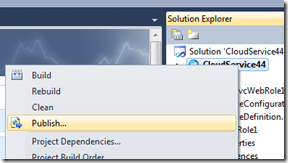
To enable IntelliTrace, right click on the cloud service project and select “Publish”.
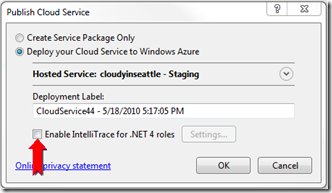
At the bottom of our publish dialog, click to select “Enable IntelliTrace for .NET 4 roles”.
You can also configure IntelliTrace for the cloud settings (these are separate from the settings in Tools | Options which are used for the debug (F5) scenario which we currently do not support with Cloud Services/Development Fabric.
A couple of notes about IntelliTrace settings.
We default to high mode which is different from the F5 IntelliTrace settings in Visual Studio. The reason is that F5 IntelliTrace includes both debugger and IntelliTrace data while in the cloud, you are only able to get back IntelliTrace data.
Additionally, we exclude Microsoft.WindowsAzure.StorageClient.dll as we found that the slow down caused by IntelliTrace instrumenting resulted in time outs to storage. You may find you will want to remove the storage client assembly from the exclusion list.
To reset the IntelliTrace settings back to the default, you can delete “collectionplan.xml” from %AppData%\Roaming\Microsoft\VisualStudio\10.0\Cloud Tools
Click “OK” to package up everything you need to IntelliTrace the web and worker host processes in the cloud and start the deployment process.
Note: There is a current limitation that child processes cannot be IntelliTrace debugged.
The deployment process is completely asynchronous so you can continue to work while you wait for deployment the to complete and you can track the progress through the Windows Azure Activity Log tool window.
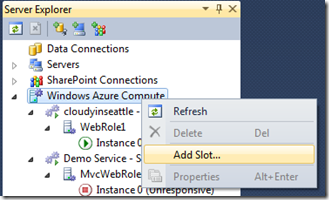
After the deployment has completed, open up the Windows Azure Compute node in Server Explorer to browse hosted services deployed to Windows Azure.
You can add a hosted service by right clicking on the Windows Azure Compute node and selecting “Add Slot…”
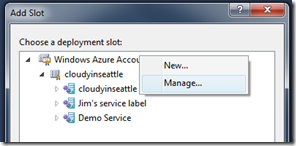
This will bring up a dialog you can use to choose a slot or add/manage your credentials.
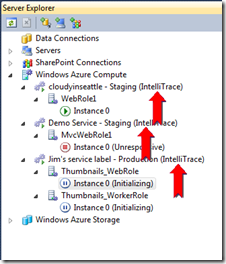
The Server Explorer will show you which Hosted Services have IntelliTrace enabled. They are the ones that have “(IntelliTrace)” beside the slot name.
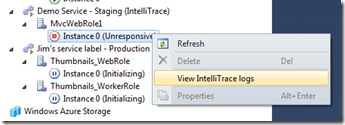
Expand open the nodes and navigate to an instance, you can get the IntelliTrace logs for that instance by right clicking on the instance node and selected “View IntelliTrace Logs”.
Note: When a role process exits, it automatically gets restarted by the fabric, which causes the cycling role state behavior that some of you are familiar with. When IntelliTrace is enabled, when a role process exits, it is not restarted and it is put into the “Unresponsive” state instead. This allows you to get the IntelliTrace logs for the failure.
Similar to how you can track the progress of deployment from the Windows Azure Activity Log, you can also track the the download of the IntelliTrace logs asynchronously.
You’ll then see the IntelliTrace files open in Visual Studio.
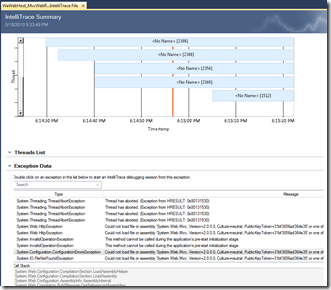
You can now browse the Exception Data on the summary page or put Visual Studio into debug mode by clicking and exception and clicking the “Start Debugging” button or by double clicking on one of the threads in the thread list.
Being in debug mode will bring up the IntelliTrace tools window which will show you all of the IntelliTrace events. You can filter between different categories and “Switch to Calls View” which will show you the call stack that you can drill in and out of various methods.
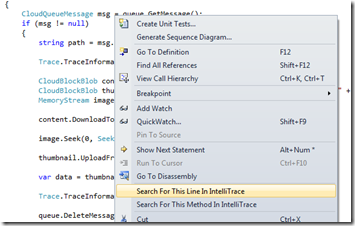
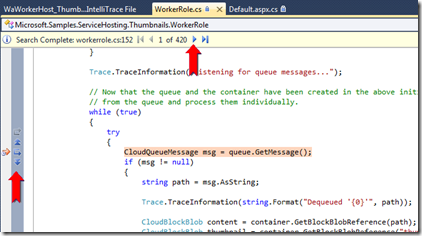
You can also open up your source code and right click on a line and select “Search for this line in IntelliTrace”.
When the search is complete, you can click on the navigation buttons at the top of the file to select one of the instances in which this code was called and use the historical debugging buttons on the left to debug forward and backward through the code looking at the call stack and locals as step through the control flow.
Debugging Common Issues Using IntelliTrace
Missing an Assembly in the Service Package:
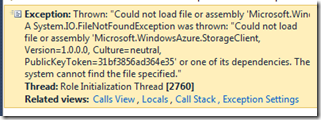
This is by far one of the most common "works on the devfabric, fails in the cloud" issues. View the IntelliTrace log and look for FileNotFoundExceptions in the exception list or IntelliTrace events.
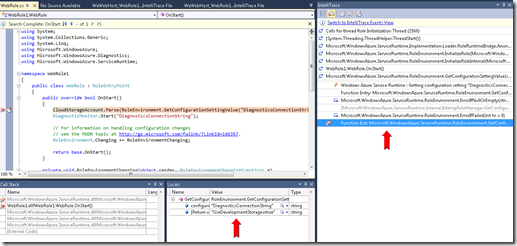
In the IntelliTrace events window:
Using an incorrect Windows Azure storage connection string:
This one is a little tougher as there isn’t a top level exception you can look at. Search for the methods in IntelliTrace where you use connection strings and see the input and return values. For example the CloudStorageAccount and DiagnosticMonitor calls.
Missing a CRT library in the Cloud:
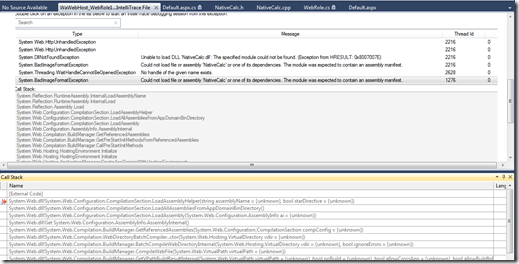
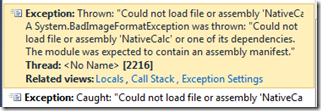
For the scenario where you are calling into a native dll but did not xcopy deploy the CRT along with his Service Package, an exception will surface in the IntelliTrace summary naming the native dll that could not be loaded.
Using a 32 Bit Native Library in the Cloud:
This issue is very similar to the missing CRT example above, in this scenario you’ve been successfully developing with a 32 bit machine and but get a failure in the cloud when the 32 bit dll is loaded in a 64 bit process.
With IntelliTrace, an exception showing which native library failed to load is surfaced in the IntelliTrace summary screen.
In the case where the loading of the assembly is triggered by a method call that is outside of the startup code, you can double click the exception to get to the line of their code that made the call to native that loaded up the dll.
Using code that requires admin access:
If you are running into this issue, you should be testing against the Development Fabric before deploying to the cloud. That said, our support data shows that this is one of the issues you run into.
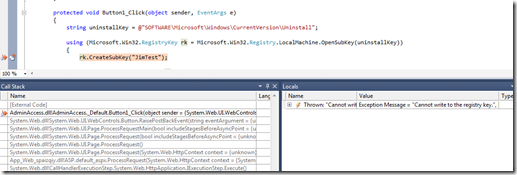
I tried to do a registry write to HKLM, which fails in the following way:
An exception is shown in the IntelliTrace summary and when double clicked, will navigate to the line of code that is causing the exception.
Using an ASP.NET provider with the default SQL Server connection string in the cloud:
In this scenario, you are using the ASP.NET providers, the default MVC and ASP.NET Web Application templates both use these. In the devfabric, they work fine as they use SQL Express under the hood by default. When you deploy to the cloud, they no longer work. (An exception web page is shown after a wait)
In opening the IntelliTrace summary, you will see the exception "Unable to connect to SQL Server database" with a stack trace that points to one of the providers, in my example, it was the SqlMembershipProvider.
Using a Diagnostics connection string with a connection string that uses HTTP endpoints:
In this scenario, you’ve deployed to the cloud but forgot to change your Windows Azure storage connection strings. If you incorrectly select to use HTTP endpoints for the storage account and didn't try running your app with the new connection strings on the devfabric before deploying, you can run into this problem.
When opening the IntelliTrace log, you will see an exception in the summary indicating that the endpoint is not a secure connection.
To sum up, I’m really excited about this feature, I hope it will really help a lot of people see into the cloud and diagnose issues saving both time and frustration.
