Configuring Logging in a Console Application
In my previous post, I introduced my simple, but highly effective approach to logging. As promised, this post introduces how to configure logging (based on a simple console application).
As noted in my previous post, one or more trace listeners can be configured for a particular System.Diagnostics.TraceSource.
To understand the configuration of various trace listeners, consider the following console application:
 using System;
using System.Diagnostics;
using System.Globalization;
using System.Text;

using Fabrikam.Demo.CoreServices.Logging;

namespace Fabrikam.Demo.AdminConsole
{
    class Program
    {
        static void Main(
            string[] args)
        {
            try
            {
                LogCommandLine("AdminConsole.exe", args);

                // Parse the command line arguments and initialize the work
                // ...

                // Process the work
                Process();
            }
            catch (Exception ex)
            {
                Logger.LogCritical(ex.Message + "\n" + ex.StackTrace );
                Logger.Flush();
                Environment.Exit(1);
            }

            Logger.LogInfo("Program complete.");
            Logger.Flush();
        }

        private static void LogCommandLine(
            string program,
            string[] args)
        {
            Debug.Assert(string.IsNullOrEmpty(program) == false);
            Debug.Assert(args != null);

            StringBuilder commandLineBuilder = new StringBuilder(program);
            for (int i = 0; i < args.Length; i++)
            {
                commandLineBuilder.Append(" ");
                commandLineBuilder.Append(args[i]);
            }

            string commandLine = commandLineBuilder.ToString();
            Logger.LogInfo(commandLine);
        }

        private static void Process()
        {
            Logger.LogDebug("Starting processing...");

            // Simulate the processing of a work item queue.
            for (int i = -1; i <= 4; i++)
            {
                ProcessWorkItem(i);
            }

            Logger.LogInfo("Successfully completed processing.");
        }
        private static void ProcessWorkItem(
            int workItemId)
        {
            // If an error occurs processing a work item, we want to
            // log a warning, but continue processing the next work item.
            try
            {
                // Simulate processing of the work item by simply
                // showing the square root of the work item Id.
                ShowSquareRoot(workItemId);
            }
            catch (ArgumentException ex)
            {
                Logger.LogWarning(
                    CultureInfo.InvariantCulture,
                    "Unable to process work item {0} ({1}).",
                    workItemId,
                    ex.Message);
            }
        }

        private static void ShowSquareRoot(
            double d)
        {
            if (d < 0.0)
            {
                throw new ArgumentException(
                    "The value must be greater than or equal to zero.",
                    "d");
            }


            Logger.LogDebug(
                CultureInfo.InvariantCulture,
                "Computing square root of {0}...",
                d);

            double sqrt = Math.Sqrt(d);
            Debug.Assert(double.IsNaN(sqrt) == false);

            Console.WriteLine(
                "The square root of {0} is {1:0.000}.",
                d,
                sqrt);
        }
    }
}
Running this program without configuring any trace listeners results in the following output to the console:
The square root of 0 is 0.000.
The square root of 1 is 1.000.
The square root of 2 is 1.414.
The square root of 3 is 1.732.
The square root of 4 is 2.000.
Notice that none of the log messages are displayed in the console output.
However, if we start DebugView before running the program, then we can easily view all of the log messages.
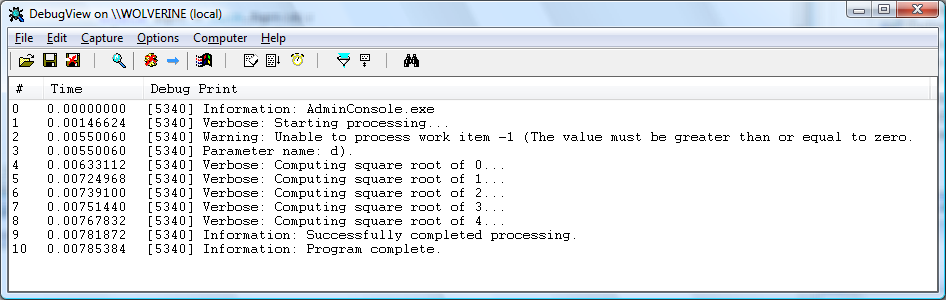
Figure 1: DebugView (a.k.a. Dbgview.exe)
To show the log messages in the console, we simply need to configure a listener. For a console application, this is done using the application configuration file (which is located in the folder with the application executable and has the name of the application with the ".config" file name extension added).
 <?xml version="1.0" encoding="utf-8" ?>
<configuration>
  <system.diagnostics>
    <sources>
      <source name="defaultTraceSource" switchValue="All">
        <listeners>
          <add name="consoleListener" />
          <!--
            Remove the Default listener to avoid duplicate messages
            being sent to the debugger for display
          -->
          <remove name="Default" />
        </listeners>
      </source>
    </sources>
    <sharedListeners>
      <add
        type="System.Diagnostics.ConsoleTraceListener"
        name="consoleListener"
        traceOutputOptions="None" />
    </sharedListeners>
  </system.diagnostics>
</configuration>
With this configuration, the console output shows:
defaultTraceSource Information: 0 : AdminConsole.exe
defaultTraceSource Verbose: 0 : Starting processing...
defaultTraceSource Warning: 0 : Unable to process work item -1 (The value must be greater than or equal to zero.
Parameter name: d).
defaultTraceSource Verbose: 0 : Computing square root of 0...
The square root of 0 is 0.000.
defaultTraceSource Verbose: 0 : Computing square root of 1...
The square root of 1 is 1.000.
defaultTraceSource Verbose: 0 : Computing square root of 2...
The square root of 2 is 1.414.
defaultTraceSource Verbose: 0 : Computing square root of 3...
The square root of 3 is 1.732.
defaultTraceSource Verbose: 0 : Computing square root of 4...
The square root of 4 is 2.000.
defaultTraceSource Information: 0 : Successfully completed processing.
defaultTraceSource Information: 0 : Program complete.
Notice that System.Diagnostics.ConsoleTraceListener outputs the name of the TraceSource (which in this case is "defaultTraceSource") as well as the event Id (which, for my simple Logger class is always 0). It can also be configured to show other fields, such as thread Id.
A TraceSwitch can also be configured to control tracing and debug output. For example, the following configuration specifies that the trace source should ignore low-level debugging and information messages, and only show warning and error messages.
 <?xml version="1.0" encoding="utf-8" ?>
<configuration>
  <system.diagnostics>
    <sources>
      <source name="defaultTraceSource" switchName="warningTraceLevel">
        <listeners>
          <add name="consoleListener" />
          <!--
            Remove the Default listener to avoid duplicate messages
            being sent to the debugger for display
          -->
          <remove name="Default" />
        </listeners>
      </source>
    </sources>
    <sharedListeners>
      <add
        type="System.Diagnostics.ConsoleTraceListener"
        name="consoleListener"
        traceOutputOptions="None" />
    </sharedListeners>
    <switches>
      <!-- Use this switch to output all log messages -->
      <add name="allTraceLevel" value="All" />
      <!-- Use this switch to output low-level debugging, informational,
        warning, and error messages -->
      <add name="verboseTraceLevel" value="Verbose" />
      <!-- Use this switch to output informational, warning,
        and error messages -->
      <add name="infoTraceLevel" value="Info" />
      <!-- Use this switch to output warning and error messages -->
      <add name="warningTraceLevel" value="Warning" />
      <!-- Use this switch to output error messages -->
      <add name="errorTraceLevel" value="Error" />
      <!-- Use this switch to output no tracing messages -->
      <add name="offTraceLevel" value="Off" />
    </switches>
  </system.diagnostics>
</configuration>
With this configuration, the console output is:
defaultTraceSource Warning: 0 : Unable to process work item -1 (The value must be greater than or equal to zero.
Parameter name: d).
The square root of 0 is 0.000.
The square root of 1 is 1.000.
The square root of 2 is 1.414.
The square root of 3 is 1.732.
The square root of 4 is 2.000.
With just a little more configuration, we can specify that we want all log messages to go to the console (for example, so the person running the utility can easily monitor the progress of some long-running operation) but only output information, warning, and error messages to a file (possibly for later review).
In the following configuration, note the new logFileTraceListener and the corresponding <filter> element used to limit the file output to level "Information" (and above -- which includes warning and error messages).
 <?xml version="1.0" encoding="utf-8" ?>
<configuration>
  <system.diagnostics>
    <sources>
      <source name="defaultTraceSource" switchName="allTraceLevel">
        <listeners>
          <add name="consoleListener" />
          <add name="logFileTraceListener" />
          <!--
            Remove the Default listener to avoid duplicate messages
            being sent to the debugger for display
          -->
          <remove name="Default" />
        </listeners>
      </source>
    </sources>
    <sharedListeners>
      <add
        type="System.Diagnostics.ConsoleTraceListener"
        name="consoleListener"
        traceOutputOptions="None" />
      <add
        type="System.Diagnostics.TextWriterTraceListener"
        name="logFileTraceListener"
        initializeData="AdminConsole.log"
        traceOutputOptions="DateTime">
        <!--
          Use a filter so that log file excludes low-level debugging messages
        -->
        <filter type="System.Diagnostics.EventTypeFilter"
          initializeData="Information" />
      </add>
    </sharedListeners>
    <switches>
      <!-- Use this switch to output all log messages -->
      <add name="allTraceLevel" value="All" />
      <!-- Use this switch to output low-level debugging, informational,
        warning, and error messages -->
      <add name="verboseTraceLevel" value="Verbose" />
      <!-- Use this switch to output informational, warning,
        and error messages -->
      <add name="infoTraceLevel" value="Info" />
      <!-- Use this switch to output warning and error messages -->
      <add name="warningTraceLevel" value="Warning" />
      <!-- Use this switch to output error messages -->
      <add name="errorTraceLevel" value="Error" />
      <!-- Use this switch to output no tracing messages -->
      <add name="offTraceLevel" value="Off" />
    </switches>
  </system.diagnostics>
</configuration>
This produces a file named AdminConsole.log with the following content:
 defaultTraceSource Information: 0 : AdminConsole.exe
    DateTime=2009-06-18T16:57:54.4488429Z
defaultTraceSource Warning: 0 : Unable to process work item -1 (The value must be greater than or equal to zero.
Parameter name: d).
    DateTime=2009-06-18T16:57:54.4798429Z
defaultTraceSource Information: 0 : Successfully completed processing.
    DateTime=2009-06-18T16:57:54.4818429Z
defaultTraceSource Information: 0 : Program complete.
    DateTime=2009-06-18T16:57:54.4828429Z
Unfortunately the TextWriterTraceListener class appends the timestamp onto a separate line, but you can easily substitute a custom listener that formats results like the following, if necessary:
 2009-06-18T17:17:43 Information: AdminConsole.exe
2009-06-18T17:17:43 Warning: Unable to process work item -1 (The value must be greater than or equal to zero.
Parameter name: d).
2009-06-18T17:17:43 Information: Successfully completed processing.
2009-06-18T17:17:43 Information: Program complete.
When I wrote the Logger class a few years ago, I also wrote a SimpleTraceListener class to do just this:
 using System;
using System.Collections;
using System.Diagnostics;
using System.Globalization;
using System.IO;
using System.Runtime.InteropServices;
using System.Security.Permissions;

namespace Fabrikam.Demo.CoreServices.Logging
{
    /// <summary>
    ///
    /// </summary>
    [HostProtection(SecurityAction.LinkDemand, Synchronization = true)]
    public class SimpleTraceListener : TextWriterTraceListener
    {
        /// <summary>
        /// Initializes a new instance of the <see cref="SimpleTraceListener"/>
        /// class.
        /// </summary>
        public SimpleTraceListener()
        {
        }

        /// <summary>
        /// Initializes a new instance of the <see cref="SimpleTraceListener"/>
        /// class, using the specified stream as the recipient of the debugging
        /// and tracing output.
        /// </summary>
        /// <param name="stream">A <see cref="Stream"/> that represents the
        /// stream the <see cref="SimpleTraceListener"/> writes to.</param>
        public SimpleTraceListener(
            Stream stream)
            : base(stream, string.Empty)
        {
        }

        /// <summary>
        /// Initializes a new instance of the <see cref="SimpleTraceListener"/>
        /// class, using the specified writer as the recipient of the debugging
        /// and tracing output.
        /// </summary>
        /// <param name="writer">A <see cref="TextWriter"/> that receives the
        /// output from the <see cref="SimpleTraceListener"/>.</param>
        public SimpleTraceListener(
            TextWriter writer)
            : base(writer, string.Empty)
        {
        }

        /// <summary>
        /// Initializes a new instance of the <see cref="SimpleTraceListener"/>
        /// class, using the specified file as the recipient of the debugging
        /// and tracing output.
        /// </summary>
        /// <param name="fileName">The name of the file the
        /// <see cref="SimpleTraceListener"/> writes to.</param>
        public SimpleTraceListener(
            string fileName)
            : base(fileName)
        {
        }

        /// <summary>
        /// Initializes a new instance of the <see cref="SimpleTraceListener"/>
        /// class with the specified name, using the specified stream as the
        /// recipient of the debugging and tracing output.
        /// </summary>
        /// <param name="stream">A <see cref="Stream"/> that represents the
        /// stream the <see cref="SimpleTraceListener"/> writes to.</param>
        /// <param name="name">The name of the new instance.</param>
        public SimpleTraceListener(
            Stream stream,
            string name)
            : base(stream, name)
        {
        }

        /// <summary>
        /// Initializes a new instance of the <see cref="SimpleTraceListener"/>
        /// class with the specified name, using the specified writer as the
        /// recipient of the debugging and tracing output.
        /// </summary>
        /// <param name="writer">A <see cref="TextWriter"/> that receives the
        /// output from the <see cref="SimpleTraceListener"/>.</param>
        /// <param name="name">The name of the new instance.</param>
        public SimpleTraceListener(
            TextWriter writer,
            string name)
            : base(writer, name)
        {
        }

        /// <summary>
        /// Initializes a new instance of the <see cref="SimpleTraceListener"/>
        /// class with the specified name, using the specified file as the
        /// recipient of the debugging and tracing output.
        /// </summary>
        /// <param name="fileName">The name of the file the
        /// <see cref="SimpleTraceListener"/> writes to.</param>
        /// <param name="name">The name of the new instance.</param>
        public SimpleTraceListener(
            string fileName,
            string name)
            : base(fileName, name)
        {
        }

        private bool IsEnabled(
            TraceOptions options)
        {
            return ((options & this.TraceOutputOptions) != TraceOptions.None);
        }

        /// <summary>
        /// Writes trace information, a message, and event information to the
        /// listener specific output.
        /// </summary>
        /// <param name="eventCache">A TraceEventCache object that contains the
        /// current process ID, thread ID, and stack trace information.</param>
        /// <param name="source">A name used to identify the output, typically
        /// the name of the application that generated the trace event.</param>
        /// <param name="eventType">One of the TraceEventType values specifying
        /// the type of event that has caused the trace.</param>
        /// <param name="id">A numeric identifier for the event.</param>
        /// <param name="message">A message to write.</param>
        [ComVisible(false)]
        public override void TraceEvent(
            TraceEventCache eventCache,
            string source,
            TraceEventType eventType,
            int id,
            string message)
        {
            if ((this.Filter == null)
                || this.Filter.ShouldTrace(
                    eventCache, source, eventType, id, message, null, null, null))
            {
                this.WriteHeader(source, eventType, id, eventCache);
                this.WriteLine(message);
                this.WriteFooter(eventCache);
            }
        }

        /// <summary>
        /// Writes trace information, a formatted array of objects and event
        /// information to the listener specific output.
        /// </summary>
        /// <param name="eventCache">A TraceEventCache object that contains the
        /// current process ID, thread ID, and stack trace information.</param>
        /// <param name="source">A name used to identify the output, typically
        /// the name of the application that generated the trace event.</param>
        /// <param name="eventType">One of the TraceEventType values specifying
        /// the type of event that has caused the trace.</param>
        /// <param name="id">A numeric identifier for the event.</param>
        /// <param name="format">A format string that contains zero or more
        /// format items, which correspond to objects in the
        /// <paramref name="args"/> array.</param>
        /// <param name="args">An object array containing zero or more objects
        /// to format.</param>
        [ComVisible(false)]
        public override void TraceEvent(
            TraceEventCache eventCache,
            string source,
            TraceEventType eventType,
            int id,
            string format,
            params object[] args)
        {
            if ((this.Filter == null)
                || this.Filter.ShouldTrace(
                    eventCache, source, eventType, id, format, args, null, null))
            {
                this.WriteHeader(source, eventType, id, eventCache);
                if (args != null)
                {
                    this.WriteLine(string.Format(
                            CultureInfo.InvariantCulture, format, args));
                }
                else
                {
                    this.WriteLine(format);
                }
                this.WriteFooter(eventCache);
            }
        }

        private void WriteFooter(
            TraceEventCache eventCache)
        {
            if (eventCache == null)
            {
                return;
            }

            this.IndentLevel++;
            if (this.IsEnabled(TraceOptions.ProcessId))
            {
                this.WriteLine("ProcessId=" + eventCache.ProcessId);
            }
            if (this.IsEnabled(TraceOptions.LogicalOperationStack))
            {
                this.Write("LogicalOperationStack=");
                Stack logicalOperationStack = eventCache.LogicalOperationStack;
                bool flag = true;
                foreach (object obj2 in logicalOperationStack)
                {
                    if (!flag)
                    {
                        this.Write(", ");
                    }
                    else
                    {
                        flag = false;
                    }
                    this.Write(obj2.ToString());
                }
                this.WriteLine(string.Empty);
            }
            if (this.IsEnabled(TraceOptions.ThreadId))
            {
                this.WriteLine("ThreadId=" + eventCache.ThreadId);
            }
            if (this.IsEnabled(TraceOptions.Timestamp))
            {
                this.WriteLine("Timestamp=" + eventCache.Timestamp);
            }
            if (this.IsEnabled(TraceOptions.Callstack))
            {
                this.WriteLine("Callstack=" + eventCache.Callstack);
            }
            this.IndentLevel--;
        }

        private void WriteHeader(
            string source,
            TraceEventType eventType,
            int id,
            TraceEventCache eventCache)
        {
            if (eventCache != null)
            {
                if (this.IsEnabled(TraceOptions.DateTime))
                {
                    DateTime localTime = eventCache.DateTime.ToLocalTime();
                    string formattedDate = localTime.ToString(
                        "s",
                        CultureInfo.InvariantCulture);

                    this.Write(formattedDate);
                    this.Write(" ");
                }
            }

            this.Write(
                string.Format(
                    CultureInfo.InvariantCulture,
                    "{0}: ",
                    eventType.ToString()));
        }
    }
}
Depending on your specific needs, you could modify the WriteHeader and WriteFooter methods to output additional fields on the same line as the log message. (In my scenario, I only needed to support the TraceOptions.DateTime option.)
In my next post, I discuss logging to the ASP.NET tracing feature.