Azure@home Part 8: Worker Role and Azure Diagnostics
This post is part of a series diving into the implementation of the @home With Windows Azure project, which formed the basis of a webcast series by Developer Evangelists Brian Hitney and Jim O’Neil. Be sure to read the introductory post for the context of this and subsequent articles in the series.
Over the past five posts in this series, I’ve gone pretty deep into the implementation (and improvements) to the Web Role portion of the Azure@home project. The Web Role contains only two ASPX pages, and it isn’t even the core part of the application, so there’s no telling how many posts the Worker Role will lead to!
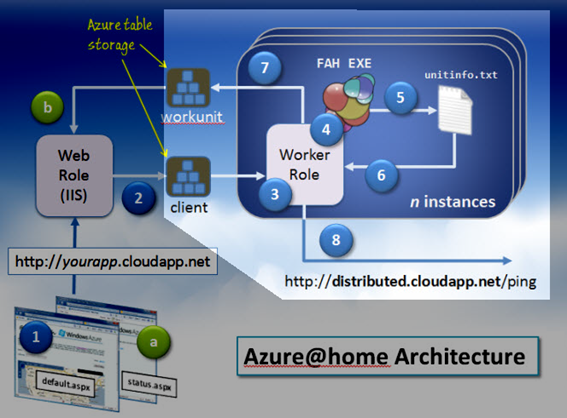
For point of reference, we’re now concentrating on the the highlighted aspect of the solution architecture I introduced in the first post of this series – the Worker Role is on the right and the Web Role on the left. One or more instances of the Worker Role wrap the Folding@home console application, launch it, parse its output, and record progress to both Azure table storage and a service endpoint hosted at https://distributed.cloudapp.net.
In Windows Azure, a worker role must extend the RoleEntryPoint class, which provides callbacks to initialize (OnStart), run (Run), and stop (OnStop) instances of that role; a web role, by the way, can optionally extend that same class. OnStart (as you might tell by its name!) is a good place for code to initialize configuration settings, and in the Worker Role implementation for Azure@home, we also add some code to capture performance and diagnostics output via the Windows Azure Diagnostics API.
As one of the core services available to developers on the Windows Azure platform, Windows Azure Diagnostics facilitates collecting system and application logs as well as performance metrics for the virtual machine on which a role is running (under full-trust). This capability is useful in troubleshooting, auditing, and monitoring the health of your application, and beyond that can form the basis of an auto-scaling implementation that is specifically aware of and tailored to the execution profile and characteristics of your services.
DiagnosticMonitor
The control flow for capturing diagnostics and performance metrics in Azure is depicted below in an image adapted from Matthew Kerner’s PDC 2009 presentation Windows Azure Monitoring, Logging, and Management APIs .
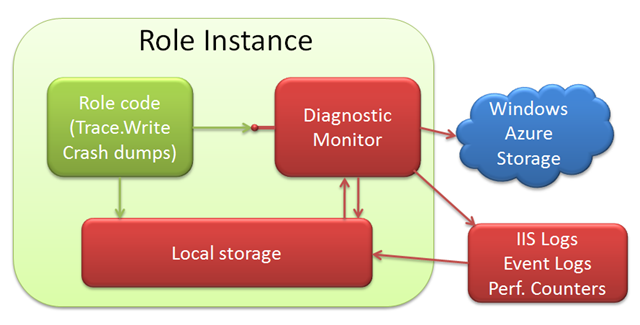
The role code you write, represented by the dark green box, coexists inside your role’s VM instance along with a Diagnostic Monitor, shown in the red box. The Diagnostic Monitor is encapsulated in a separate process – MonAgentHost.exe - that collects the desired diagnostics and performance information in local storage and interfaces with Windows Azure storage to persist that data to both tables and blobs.
In your role code, the DiagnosticMonitor class provides the means for interfacing with that external process, specifically via two static methods of note:
- GetDefaultInitialConfiguration, which yields a DiagnosticMonitorConfiguration instance with the default monitoring options, and
- Start, which signals the Diagnostic Monitor to collect the logs and performance counters as configured in the DiagnosticMonitorConfiguration instance passed to it.
DiagnosticMonitorConfiguration
Most of the work in setting up monitoring involves specifying what you want to collect and how often to collect it. – once that’s done all you have to do is call Start!
“What and how often” is configuration information stored in an instance of the DiagnosticMonitorConfiguration class, generally initialized in your role code by a call to GetDefaultInitialConfiguration. The default configuration tracks the following items:
- Windows Azure logs,
- IIS 7.0 logs (for web roles only), and
- Windows Diagnostic infrastructure logs.
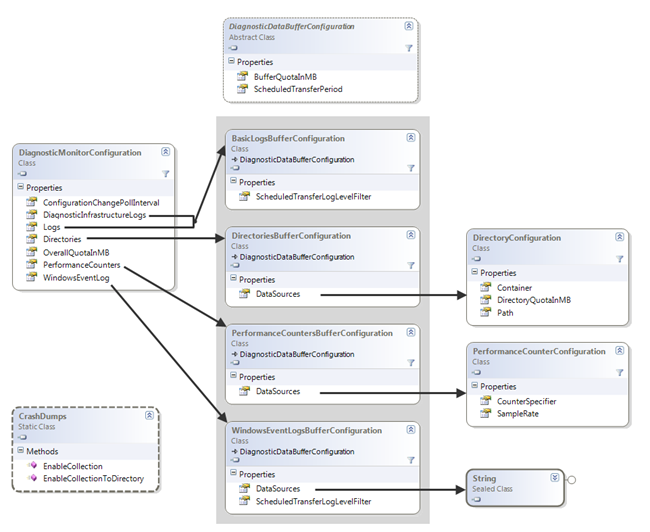
Of course you can augment that with additional logging – IIS failed requests, windows event logging, performance monitoring statistics, and custom logs – by adding to that default configuration object. Where and how to configure each item though can be a little confusing, and I’ve found walking through the class diagram comprising DiagnosticMonitorConfiguration helped me wrap my head around it all. Below is the diagram, showing the relationships between that core class’ properties and the other ancillary classes that indicate what and how often to collect the various bits of information (click the diagram to enlarge it).
Note that there are five properties of DiagnosticMonitorConfiguration that contain information about some type of statistics gathering. All allow you to individually specify a BufferQuotaInMB and ScheduledTransferPeriod.
-
DiagnosticInfrastructureLogs – configuration information for logging on the diagnostics service itself (nothing confounds more then when your diagnostics fail!). You can limit the amount of information recorded by specifying a ScheduledTransferLogLevelFilter, which indicates what level of information to collect, ranging from ‘critical’ only to ‘verbose.’
Logs – configuration information for the Windows Azure logs (also supporting a ScheduledTransferLogLevelFilter)
Directories – information on file-based logs that your application is collecting (e.g., IIS 7 logs). Each element of the DirectoryBuffersConfiguration.DataSources collection includes information about a specific log file - namely in what directory the file will be stored in local storage (Path), how big that directory can get (DirectoryQuotaInMB), and where that local file will be transferred to blog storage (Container), if and when it’s scheduled to.
PerformanceCounters – information on Windows Performance Counters (like CPU time, available memory, etc.) that you’ve decided to collect. Each counter is an element of the PerformanceCountersBufferConfiguration.DataSources collection and includes a string-valued CounterSpecifier (see Specifying a Counter Path in MSDN for details) and a SampleRate indicating how often to collect that piece of information (rounded up to the nearest second).
WindowsEventLog – information on Window Event Log information you’ve decided to collect. Here, WindowsEventLogBufferConfiguration.DataSources is a collection of strings, each of which is an XPath expression corresponding to some event log data (see Consuming Events in MSDN for details). As with the Azure logs, you can also provide a log level filter, ScheduledTransferLogLevelFilter, to include only the desired severity levels.
Lastly, the CrashDumps class seems a bit of a loner! The ultimate location of the dump files is actually part of the DiagnosticMonitorConfiguration discussed above, but to signal you’re interested in collecting them, you must call either the EnableCollection or EnableCollectionToDirectory methods of this static class.
Across the board, the OverallQuotaInMB (on the DiagnosticMonitorConfiguration class) is just under 4GB by default, and refers to local file storage on the VM instance in which the web or worker role is running. Since local storage is limited, transient, and not easily inspectable, the logs and diagnostics that you are interested in examining should be periodically copied to Windows Azure storage. That can be done regularly – hence the ScheduledTransferPeriod property – or on demand (via the RoleInstanceDiagnosticManager as shown in this MSDN example).
When data is transferred to Azure storage, where does it go? The table below summarizes that and includes the property of DiagnosticMonitorConfiguration you need to tweak to adjust the nature and the frequency of the data that is transferred.
| Diagnostic | Configuration Property | Blob/Table |
Blob Container or Table name |
| Windows Azure log | Logs | table |
WADLogsTable |
| IIS 7 log | Directories | table blob |
WADDirectoriesTable (index entry) wad-iis-logfiles |
| Windows Diagnostic Infrastructure | DiagnosticInfrastructureLogs | table |
WADDiagnosticInfrastructureLogsTable |
| IIS Failed Request log | Directories | table blob |
WADDirectoriesTable (index entry) was-iis-failedreqlogfiles |
| Crash dumps | Directories | table blob |
WADDirectoriesTable (index entry) wad-crash-dumps |
| Performance counters | PerformanceCounters | table |
WADPerformanceCountersTable |
| Windows events | WindowsEventLog | table |
WADWindowsEventLogsTable |
Note: WADDirectoriesTable maintains a single entity (row) per log file stored in blob storage.
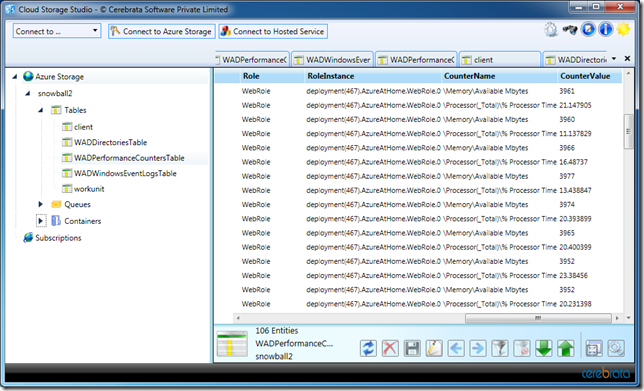
There are a number of utilities (some free) out there to peruse Azure storage – here’s a screen shot of my performance counters viewed using Cerebrata’s Cloud Storage Studio:
All right, now that we’ve got some background on configuring the various options, let’s take a look at some code. Azure@home’s Worker Role OnStart method is shown in its entirety below:
1: public override bool OnStart()
2: {
3: DiagnosticMonitorConfiguration diagConfig =
4: DiagnosticMonitor.GetDefaultInitialConfiguration();
5:
6: // Windows event logs
7: diagConfig.WindowsEventLog.DataSources.Add("System!*");
8: diagConfig.WindowsEventLog.DataSources.Add("Application!*");
9: diagConfig.WindowsEventLog.ScheduledTransferLogLevelFilter = LogLevel.Error;
10: diagConfig.WindowsEventLog.ScheduledTransferPeriod = TimeSpan.FromMinutes(5);
11:
12: // Azure application logs
13: diagConfig.Logs.ScheduledTransferLogLevelFilter = LogLevel.Information;
14: diagConfig.Logs.ScheduledTransferPeriod = TimeSpan.FromMinutes(5);
15:
16: // Performance counters
17: diagConfig.PerformanceCounters.DataSources.Add(
18: new PerformanceCounterConfiguration()
19: {
20: CounterSpecifier = @"\Processor(_Total)\% Processor Time",
21: SampleRate = TimeSpan.FromMinutes(5)
22: });
23: diagConfig.PerformanceCounters.DataSources.Add(
24: new PerformanceCounterConfiguration()
25: {
26: CounterSpecifier = @"\Memory\Available Mbytes",
27: SampleRate = TimeSpan.FromMinutes(5)
28: });
29: diagConfig.PerformanceCounters.ScheduledTransferPeriod = TimeSpan.FromMinutes(5);
30: DiagnosticMonitor.Start("DiagnosticsConnectionString", diagConfig);
31:
32: // use Azure configuration as setting publisher
33: CloudStorageAccount.SetConfigurationSettingPublisher((configName, configSetter) =>
34: {
35: configSetter(RoleEnvironment.GetConfigurationSettingValue(configName));
36: });
37:
38: // For information on handling configuration changes
39: // see the MSDN topic at https://go.microsoft.com/fwlink/?LinkId=166357.
40: RoleEnvironment.Changing += RoleEnvironmentChanging;
41:
42: return base.OnStart();
43: }
Given what we know now, it should be pretty easy to parse this and determine precisely what information we’re collecting about the Worker Role:
- Line 3 – 4 get the initial configuration – remember we get Windows Azure logs free here. This is a worker role, so IIS 7 logs are not captured.
- Lines 7 – 10 indicate we’re capturing all of the Application and System event log data that’s marked with the ‘error’ level (or worse), and it will be transferred to Windows Azure storage – specifically the WADWindowsEventLogsTable every five minutes.
- Lines 13 – 14 indicate we’re interested in informational, warning, error, and critical messages recorded for our own role as well as for the Windows Azure diagnostics itself. That data will be transferred every five minutes as well (and ultimately reside in WADLogsTable and WADDiagnosticInfrastructureLogsTable).
- Lines 17 – 28 instantiate two performance counters (one for CPU utilization, the other for memory) each sampled every five minutes.
- Line 29 then adds those counters to the diagnostic configuration, with a transfer to the WADPerformanceCountersTable occurring every five minutes.
- Line 30 starts all of the diagnostics collection providing the configuration that was set up in the previous lines of code and specifying the Windows Azure storage connection string. DiagnosticConnectionString is defined as part of the service configuration file for the Worker Role.
The remainder of the code sets up some plumbing for handling the source of the configuration settings as well as what should happen when they change; this code is identical to what we discussed for the Web Role.
DiagnosticMonitorTraceListener
There’s actually one additional cog necessary to have all this diagnostics and monitoring work for you, but it’s configured automatically when you create a web or worker role in Visual Studio (as is the code to start the diagnostics monitor with the default configuration!). Within the app.config for a worker role or the web.config for a web role, you need to configure a DiagnosticMonitorTraceListener to hook in to the familiar Trace functionality; here’s the contents of Azure@home’s Worker Role app.config.
<?xml version="1.0" encoding="utf-8" ?>
<configuration>
<system.diagnostics>
<trace>
<listeners>
                <add type="Microsoft.WindowsAzure.Diagnostics.DiagnosticMonitorTraceListener,
                           Microsoft.WindowsAzure.Diagnostics, Version=1.0.0.0,
                           Culture=neutral, PublicKeyToken=31bf3856ad364e35"
name="AzureDiagnostics">
<filter type="" />
</add>
</listeners>
</trace>
</system.diagnostics>
</configuration>
Bonus Section: External Diagnostics
Let’s take all this diagnostics monitoring up a notch! The diagnostics monitor is a separate process (MonAgentHost.exe) which not only limits its impact on your own code running but also opens up the option to monitor externally. What if you don’t want to collect all that data all the time, or what if you have clients that are seeing a performance issue right now? You really don’t want to bring down the application, re-instrument it, re-provision it, and hope the problem persists; it’s highly doubtful your customer will have the patience for you to do all that anyway!
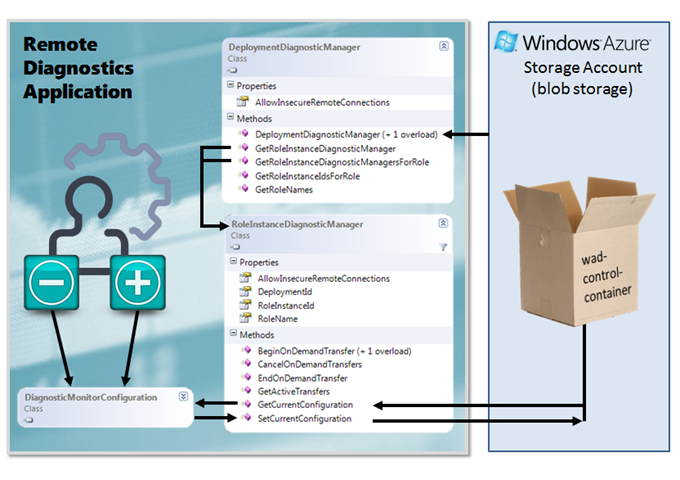
Earlier in this post, I alluded to the ability to transfer logs and diagnostics to Azure storage on demand, as you might do for defined checkpoints in your application’s workflow. That functionality is enabled by the RoleInstanceDiagnosticManager class, which is also the linchpin of remote diagnostics. As shown below, configuring remote diagnostics involves interacting with the diagnostics configuration stored in Windows Azure storage – specifically in a blob container called wad-control-container.
It’s roughly a five step-process:
- Instantiate a DeploymentDiagnosticManager instance given Windows Azure storage account credentials and a specific Azure deployment id. The deployment ID is 32-character hexadecimal value displayed on the Azure portal for the given hosted service deployment; for the local development fabric it’s the string deployment followed by a integer in parentheses – like deployment(479).
- Get a set of or single RoleInstanceDiagnosticManager instance corresponding to a given role name and, optionally, instance id of the Azure compute instances you’re interested in configuring.
- Access the configuration for those instances (via GetCurrentConfiguration), yielding a DiagnosticMonitorConfiguration instance, which was described in gory detail earlier in this post.
- Make the desired changes to that configuration – adding or removing logging and tracing options as well as performance counters – via the various DiagnosticDataBufferConfiguration classes.
- Update the configuration (via SetCurrentConfiguration) to push the changes back to Windows Azure blob storage.
The diagnostics manager will then pick up the changes the next time the configuration is polled (as specified by ConfigurationChangePollInterval).
Don’t forget to set a transfer period if you’re introducing a new counter or log configuration; otherwise, you’ll be happily collecting information into local storage but never see it appear in the expected tables or blob containers in your Windows Azure diagnostics storage account.
To bring it all together, here’s a complete console application implementation that accepts a deployment id on the command line and sets up a performance counter to collect the CPU utilization every 30 seconds for all instances of a role called “WebRole” and transfer that data to the WADPerformanceCountersTable every 10 minutes.
using System;
using Microsoft.WindowsAzure.Diagnostics;
using Microsoft.WindowsAzure.Diagnostics.Management;
namespace RemoteDiagnostics
{
class Program
{
static void Main(string[] args)
{
String deploymentID = null;
if (args.Length == 1)
deploymentID = args[0];
else
return;
try
{
// manager requires Azure storage string and deployment ID
DeploymentDiagnosticManager ddm =
new DeploymentDiagnosticManager(
Properties.Settings.Default.DiagnosticsConnectionString,
deploymentID);
// create a performance counter for number of requests
PerformanceCounterConfiguration perfCounter =
new PerformanceCounterConfiguration()
{
CounterSpecifier = @"\Processor(_Total)\% Processor Time",
SampleRate = TimeSpan.FromSeconds(30)
};
// add counter to each instance of WebRole
foreach (var r in ddm.GetRoleInstanceDiagnosticManagersForRole("WebRole"))
{
DiagnosticMonitorConfiguration diagConfig = r.GetCurrentConfiguration();
diagConfig.PerformanceCounters.DataSources.Add(perfCounter);
diagConfig.PerformanceCounters.ScheduledTransferPeriod =
TimeSpan.FromMinutes(10);
r.SetCurrentConfiguration(diagConfig);
}
}
catch (Exception e)
{
System.Console.WriteLine(e.Message);
System.Console.ReadLine();
}
}
}
}
Next time: When OnStart has completed, the next method in the role lifecycle is Run, and we’ll pick it up at that point!
