G is for… Generation

Generation refers to a classification of managed memory that the Common Language Runtime (CLR) garbage collector uses to improve its performance. The CLR garbage collector is an implementation of a tracing garbage collector or more specifically, a generational or ephemeral garbage collector.
A tracing garbage collector is one that marches through memory to determine which objects are reachable (i.e., have live references) and which are not. When the collection starts, the assumption is that all objects on the heap are garbage, and a marking phase ensues in which thread stacks are walked looking for memory references (also called roots). Objects on the heap that are reached in a recursive fashion from these roots are marked, until all the roots have been examined.
After the marking phase, the heap is compacted, and the unmarked (unused) blocks are moved up in memory, keeping all of the used blocks contiguous (for the most part).
Obviously the marking phase and the ensuing compaction process are expensive operations, and that’s where the concept of generational garbage collectors comes in. The .NET CLR defines three generations as follows:
- Generation 0
- Generation 1
- Generation 2
The generation number refers to the number of garbage collection cycles an object has survived and so is a measure of the age of the object. Specifically, a Generation 0 object is one that the garbage collector has never examined (perhaps one that has be newly created), whereas Generation 2 objects have survived two or more such cycles.
Each generation also has a budget, the value of which may change dynamically as the garbage collector self-tunes. When the combined size of all Generation 0 objects reaches its budget (let’s say it’s 128KB), then a subsequent allocation will force a garbage collection on Generation 0 objects. The surviving objects are promoted to Generation 1, and the unreachable objects are collected as mentioned above. At this point, there will be no objects at Generation 0 (save the newly created one that prompted the garbage collection to occur).
A Generation 1 garbage collection will occur only after a Generation 0 collection request has detected that the combined size of objects in Generation 1 exceeds its budget. At that point, the marking and compaction phase will occur on the Generation 1 objects, and its surviving objects get promoted to Generation 2.
Likewise, when a Generation 1 garbage collection operation is requested, the size of Generation 2 objects will also be checked against that generation’s threshold. Since Generation 2 is the oldest generation supported in the .NET CLR garbage collection, surviving objects remain marked as Generation 2. It also turns out that large objects (of size greater then 85000 bytes) are immediately marked as Generation 2, which of course means that short-lived large objects will not be collected frequently, the impact of which should be considered in your application design.
The philosophy of the garbage collection technique is that newer objects are typically short-lived, and that the older the object, the longer it’s likely to be around. As a result, you can typically expect many garbage collection cycles of Generation 0, but it may take multiple such cycles before Generation 1 is full enough to prompt a collection at that level (and so forth for Generation 2).
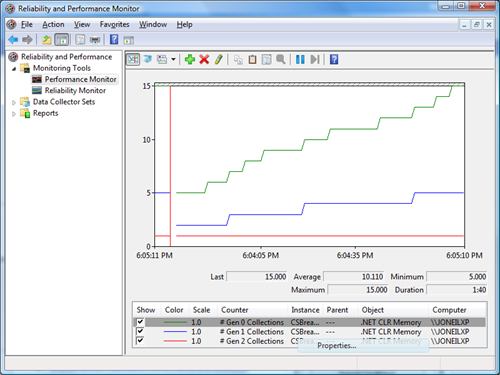
You can get visibility into the behavior of your application by using Performance Monitor, which has built-in counters for a variety of garbage collection metrics, including the number of collections that have occurred at each generation, which you can see below.

Note how much more frequently (in this case, anyway), the Generation 0 collection occurs; this is somewhat typical and as a general rule the number of Generation 2 collections (which are quite expensive) should be a fraction of the Generation 0 collections. In terms of performance, Generation 1 collections are just slightly more expensive than Generation 0 collections, so unless there’s an inordinate number of them, you shouldn’t be too concerned with their quantity.
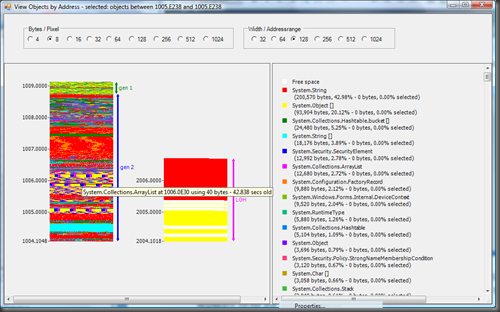
And if you really want a deep dive, check out the CLR Profiler. It has over a dozen different graphs, histograms, and reports to show exactly what’s happening to the managed heap as your application is running. The Objects By Address graph below, for instance, shows the Generation 1 (gen 1, at top) and Generation 2 (gen 2) objects, color-coded to their types. There’s even hover support on the graph showing the size and age of a specific allocation.
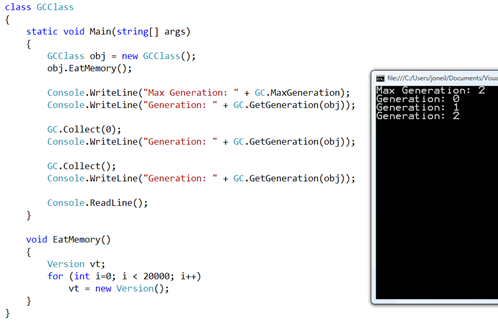
Of course, there’s also a programmatic interface to garbage collection, the static System.GC class. The sample below shows the creation of an object, and forced garbage collection showing how the object ‘ages’ through three generations. Note, this is purely for demonstrating features of the API. In the vast majority of cases, you should not call the GC.Collect method explicitly, as doing so can actually have a negative effect on performance.

Here’s a few good references on garbage collection that I ran across when putting this post together:
- Visual Studio 2008 Developer Center documentation
- MSDN Magazine: CLR Inside Out: Investigating Memory Issues
- Using GC Efficiently, Part 1
- Garbage Collection Technology Sample on MSDN
- CLR Profiler
