Disk I/O Case Study: Classic Case of SAN Over-Subscription
SAN Over-Subscription
There are a variety of challenges related to I/O performance. One common problem is "SAN Over-Subscription", which is characterized by the the following symptoms:
- High disk latency and
- Low IOPs & Throughput
As MS PFE & fellow perf engineer Shane Creamer describes it, think of sucking your favorite adult beverage through a pinched straw.
Preamble
Recently I had the pleasure of working with my A.C.E. colleague Jon Picariello & MS IT SAN Admin Russell Folsome on an internal Microsoft application. This post describes that gig's big win.
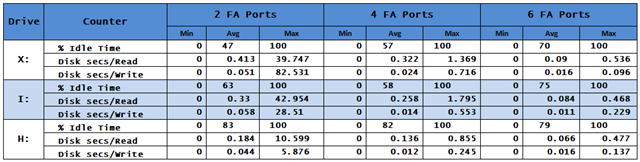
I/O Data: The Table
The customer was experiencing significant I/O challenges. Jon compiled the following table from PerfMon logs he captured.
I/O Data: The Chart
I used his information to generate the following chart.
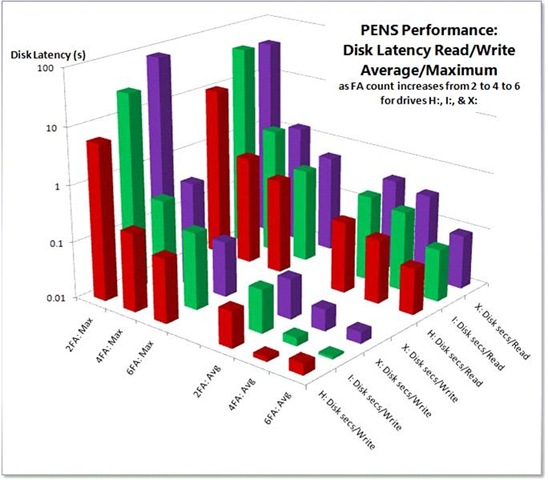
Let's examine the chart, which displays the following five dimensions:
- Lower Right Axis
- Drive letter: H:, I:, & X:
- Disk latency counter: Disk sec/Read & Disk sec/Write
- Lower Left Axis
- FA count: 2, 4, & 6
- Disk Latency metric: Avg & Max
- Left Vertical Axis
- Disk Latency in seconds (yes, whole seconds not milliseconds!)
The columns are divided into four quadrants
- Max latency values for Disk sec/Read
- Max latency values for Disk sec/Write
- Avg latency values for Disk sec/Read
- Avg latency values for Disk sec/Write
It doesn’t take pattern recognition skills commensurate with membership in Mensa to see the trends. Max & Avg Read & Write latency for all three drives improved dramatically with the each addition of Fiber Adapter pairs.
I/O Data: The Discussion
Thresholds
For systems from which high performance is expected, average disk latency should be no more than 5 – 10ms for OLTP db data files. Occasional spikes may be acceptable, but extended plateaus are not. Values for log files should not exceed 0 – 2ms
I'll spare you the screen scrapes, yet were I less merciful you’d see that the IOPs consumed by H:, I:, & X: ought to require only 3 disks, 9 disks, & 6 disks respectively—a total of 18 disks—to handle the maximum loads with ease. Instead, as you see we have latency values out the wazooticles—orders of magnitude higher than acceptable.
The fact that this isn’t happening means either:
- We don’t have enough disks
- The disks are too busy servicing other requests
- A bottleneck in the SAN
The Usual Suspects? No!
High latency is a symptom. Jon nailed it. But we needed to know what was causing the latency. Jon confirmed that disk partition alignment had already been done. (Did you know that disk partition alignment may be the best kept secret in SQL Server performance?) Russ the SAN man confirmed that HBA queue depth had been elevated to 64. Elevation of of this setting from the typical default of 32 to 64 (& sometimes more) is a best practice. (See SQL CAT's Mike Ruthruff's Predeployment I/O Best Practices for more details.) Per best practice, file allocation unit size was 64KB.
Too Few Disks? No!
We were told the SAN presented a total of 400 disks to us. Not taking RAID into account, even 10K disks should support at least 40,000 IOPs & 40,000 MB/s. (You might come up with somewhat different numbers; the point is the actual throughput is orders of magnitude lower than theoretical.)
Too Busy Disks? No!
The disks aren’t too busy. Examine the idle times in the table or the chart—virtually all above 50%.
Note on % Idle Time
The % Idle Time counter is a bit controversial & misunderstood. Like disk queue length, it can be & often is misused. I will be publishing a series of posts in which I talk about these disk counters. Be prudent in using & interpreting values from this counter!
The Perpetrator Revealed: SAN Over-Subscription
As described above, 18 disks could theoretically provide the observed performance, so 400 disks are plenty. The disks are largely idle. That leaves only one other option: a bottleneck in the SAN.
Why is the I/O that is being provided delivered at such high latency? Why can’t 400 disks—disks which PerfMon reports are idle half the time—produce the throughput even of only 18? By the definition I shared in the opening paragraph, this describes a classic case of SAN Over-Subscription.
Viola!
It turns out that the number of Fiber Adapters was on the shy side. Thanks to the prompt & enthusiastic efforts of MSIT SAN Man Russell Folsome, the count was elevated from two to four & eventually to six.
The improvements are remarkable. Note that the vertical axis is logarithmic in order to display all data values which transcend five orders of magnitude. Improvements exceeding two orders of magnitude were achieved in virtually every category.
Their world is now a different, much better place to be in. As my friend the cellist says, “Viola! ”
Query Tuning
In addition, we counseled the application team that it was their responsibility to remediate the expensive queries we identified. Doing so would provide compliance with best practices & provide head room.
Fundamental Troubleshooting
You might think, "Well, duh, Jimmy May, you threw more hardware at it, so of course it's going be faster". Well, that's not necessarily so. For example, if we'd've thrown more disks at the problem, or more memory, or more CPU, the numbers wouldn't've changed much. By analyzing a simple PerfMon log, we were able to point to the SAN. Fundamental performance troubleshooting definitively identified the area of the bottleneck. By collaborating with a cooperative SAN admin, we were able to remediate the problem.
Related Posts
- PerfMon Objects, Counters, Thresholds, & Utilities for SQL Server
- Disk I/O: Microsoft SQL Server on SAN Best Practices from SQL CAT's Mike Ruthruff (& Prem Mehra)
- Stay tuned for my series on Disk I/O counters.
Acknowledgements
In addition to A.C.E. colleague Jon Picariello & MS IT SAN Man Russell Folsome, thanks also to the internal team with whom we worked, especially Matt Eldridge without whose full cooperation we may not have been able to pull this off. As always, I am grateful for the consistently excellent guidance from my fellow MS perf phreaks Clint Huffman, Ken Brumfield, Shane Creamer, & Robert Smith. Thanks also
Administrivia
Jimmy May , MCDBA, MCSE, MCITP: DBA + DB Dev
Senior Performance Consultant: SQL Server
A.C.E.: Assessment, Consulting, & Engineering Services
https://blogs.msdn.com/jimmymayIf it is fast and ugly, they will use it and curse you; if it is slow, they will not use it."
—Computer science professor, billionaire, & entrepreneur David CheritonThis post was written with the PracticeThis.com plugin for Windows Live Writer