Case Study: Part 2: CXPACKET Wait Stats & 'max degree of parallelism' Option: Suppressing Query Parallelism Eliminated CXPACKET Waits & Liberated 30% of CPU
Introduction
This is the second of a four-part series:
- Introduction to Query Parallelism
- Parallelism Suppression: Analysis, Remediation, & Results (this post)
- Parallel Query Identification & Remediation
- Summary
Executive Summary
In my first post in this series, I documented introductory information related to query parallelism in SQL Server.
Be clear! This series is not an indictment of query parallelism.
SQL Server Customer Advisory Team (SQL CAT) Principal Program Manager Lead Lindsey Allen recently shared the following with me, "CXPACKET waits are just a symptom of either consumer or provider is waiting on some other resources, which likely are IO, CPU, or memory grant. It is misleading to jump to the conclusion that CXPACKET waits are a bad thing in general."
As I stated previously, properly designed reporting, DSS, & warehouse systems use query parallelism to advantage. Yet many OLTP workloads benefit from suppressing query parallelism by reconfiguring the value for max degree of parallelism from 0 (the default value) to 1. MVP Andrew J. Kelly stated in a session he hosted at the PASS 2008 Community Summit, "CXPACKET waits are a direct result of delays associated with inefficiencies of parallel processing".
Inefficiencies indeed. In this post I document the following:
- Discovery of a pathological level of CXPACKET waits on an OLTP system
- Suppression of query parallelism by changing max degree of parallelism from 0 to 1
- The compelling results:
-
-
- CXPACKET wait stats were virtually eliminated, reduced from 73.8% to 0.000002% of total waits.
- 30% lower levels of CPU utilization were achieved & sustained.
-
CXPACKET Waits: Analysis
Recently during a routine performance analysis at a customer site on an OLTP server, wait stats analysis revealed that query parallelism was a significant SQL Server bottleneck.
See my post Drum Roll, Please...The Debut of The SQL DMV All-Stars Dream Team! for syntax.
73.8% of SQL Server waits were attributable to CXPACKET waits, i.e., inefficiencies related to query parallelism sys.dm_os_wait_stats consisted of 81,781,945ms of 110,825,734ms total per day. 73.8% surpasses the threshold of 5% for a CXPACKET wait bottleneck as documented by Tom Davidson, et al. in SQL Server 2005 Waits & Queues. (See my previous post for additional details.)
CXPACKET Waits: Remediation
We notified appropriate stakeholders & per best practice for OLTP systems set the configuration option for max degree of parallelism from 0 to 1, re-initialized wait stats, then compared before-&-after results. (Note: I don't recommend modifying this setting on production systems without thorough testing, yet this server had plenty of CPU headroom—besides which the customer had, er, ah, a rich & courageous heritage related to change management.)
Holy correlated wait stats! After suppressing parallelism, total relevant waits per day were reduced to only 12.5% of their former levels—a reduction of almost a full order of magnitude. CXPACKET waits were trivial, responsible for only 0.000002% compared to their previous levels, i.e., inefficiencies related to query parallelism sys.dm_os_wait_stats consisted of 2ms of a reduced total of 13,836,740ms. The following figure documents these results.
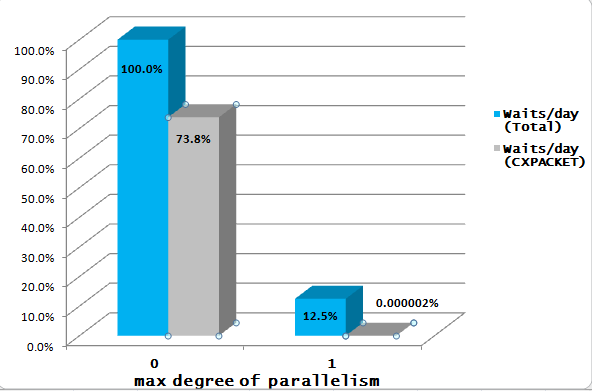
Figure 1. Total wait stats and CXPACKET waits before & after reconfiguring max degree of parallelism from 0 (the default value) to 1 (the value generally recommended for OLTP systems).
Anatomy of an Option Change: Same Day Before-&-After CPU Analysis
"Cool", you say, "waits are down, & CXPACKET waits are ¡hasta la vista, baby! But, Jimmy May, what does that mean for us admins & our users, eh?"
You want change you can really believe in? Then check out the results in terms of CPU utilization which were also compelling. Average CPU Load (95th percentile) decreased from 37% to 26%, an enhancement in CPU of 30% . Though CPU wasn’t previously a bottleneck on this system, this was considered a significant engagement win & demonstrates the value of compliance with best practices.
I can't speak for you, but I'll celebrate the liberation of an additional 30% of CPU every time. So how about a big w00t-w00t, eh? Consider what the impact would be for a server for which CPU were a bottleneck.
The following numbers refer to the balloons in Figure 2 representing data captured on 24 September 2008. The mitigating effect the configuration change had on CPU is clear.
-
- Prior to changing the max degree of parallelism from the default value of 0 to 1, CPU typically peaks in excess of 40%.
- Users leave for lunch during which CPU naturally ebbs to low levels, then spikes to 36% as users return.
- At 1:05pm, the max degree of parallelism option is changed from 0 to 1; CPU utilization drops immediately from 37% to 26%.
- With max degree of parallelism set to 1, average CPU utilization in the afternoon is significantly less compared to morning levels; afternoon spikes don't even cross 30% (compare these values to those cited in balloon 1).
Note: The following three figures contain "pinkish" spikes. These are artifacts of the monitoring utility. They are present in the images which were given to me & were not modified in any way for this post.
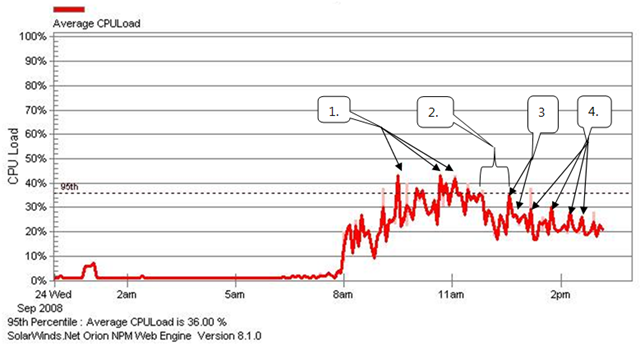
Figure 2. CPU before & after reconfiguring max degree of parallelism from 0 (the default value) to 1 (the value generally recommended for OLTP systems). See the text for details.
Sustained Success
The following figures confirm the initial success was not an aberration. The Figure 3 is from 18 September 2008, the week prior to the configuration change. Several spikes exceed 40% & one spike exceeds 50%; Average CPU Load (95th percentile) is 37%—just as during the morning of the day of the configuration change shown in Figure 2.
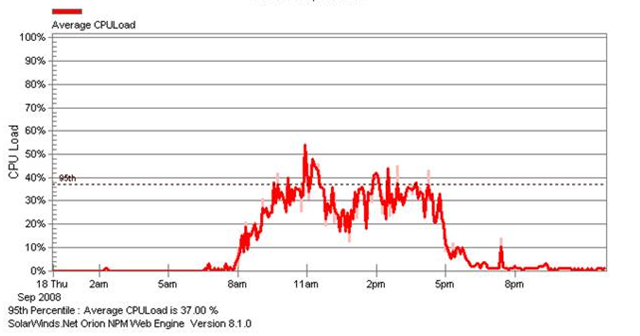
Figure 3. Average CPU Load (95th percentile) is 37% one week prior to changing max degree of parallelism from 0 to 1.
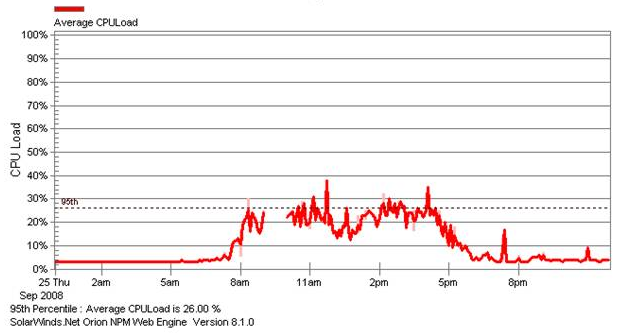
The last figure is from seven days later, 25 September 2008 (the day after the max degree of parallelism was changed); CPU spikes don't cross 40%; Average CPU Load (95th percentile) is 26%—just as it was during the afternoon that max degree of parallelism was changed from 0 to 1. Thus, after suppressing query parallelism, not only were CXPACKET waits eliminated, 30% lower levels of CPU usage were sustained.
Figure 4. Average CPU Load (95th percentile) is sustained at 26% one week after changing max degree of parallelism from 0 to 1.
Next Post: Identification & Remediation of Erstwhile Parallel Queries
We've made great progress so far, yet we're far from finished. Now that we've suppressed query parallelism, the optimizer has no choice but to execute queries serially—and thus some queries which leveraged parallelism now take longer to execute. The next post in this series, part 3 of 4 describes:
- Techniques used to identify erstwhile parallel queries
- How one such a query was remediated for additional reductions in CPU & I/O
My Related Posts
SQL Server: 4-Step Performance Troubleshooting Methodology--Introduction
PerfMon Objects, Counters, Thresholds, & Utilities for SQL Server
Drum Roll, Please...The Debut of The SQL DMV All-Stars Dream Team!
Acknowledgements
Thanks much to Brent Downing & Tom Wempe of the State of South Dakota for their contributions.
Administrivia
Jimmy May , MCDBA, MCSE, MCITP: DBA + DB Dev | Senior Performance Consultant: SQL Server
A.C.E.: Assessment Consulting & Engineering Services
https://blogs.msdn.com/jimmymay
Performance is paramount: Asking users to wait is like asking them to leave.
This post was written with the PracticeThis.complugin for Windows Live Writer