Windows Identity Foundation Samples–Trace is Your Friend
The WIF samples that come with the SDK, or the labs in the WIF training kit are great learning experiences. If you want to understand better what is going on under-the-covers, or to troubleshoot problems, turning on service log tracing is easy. Here are the steps:
1. Update web.config for both the STS and the replying party. This lets you see both sides of the WIF events. Sample config code for web site federation scenario is available on MSDN at WIF Tracing. I used a slightly modified version to change the initializeData parameter to put the log file in a preferred location. Important, use “svclog” as the file suffix.
First the STS web.config:
     <system.diagnostics>
      <sources>
            <source name="Microsoft.IdentityModel" switchValue="Verbose">
                <listeners>
                    <add name="xml" type="System.Diagnostics.XmlWriterTraceListener"
                         initializeData="c:\temp\GenericSTS_WIF.svclog"/>
                </listeners>
            </source>
        </sources>
        <trace autoflush="true"/>
    </system.diagnostics>
And next the replying party web.config:
   <system.diagnostics>
    <sources>
      <source name="Microsoft.IdentityModel" switchValue="Verbose">
        <listeners>
          <add name="xml" type="System.Diagnostics.XmlWriterTraceListener"
               initializeData="c:\temp\GenericRP_WIF.svclog" />
        </listeners>
      </source>
    </sources>

    <trace autoflush="true" />

  </system.diagnostics>
2. Recycle the application pool to be sure the web.config changes are picked up.
3. Exercise the sample or lab code to generate WIF activity. The output files will be in the location specified by the initializeData parameter.
4. If you haven’t already done so, install the latest WIF SDK. If contains the log viewer (SvcTraceViewer.exe) that opens “svclog” file types. Note: the viewer is also in the WCF SDK.
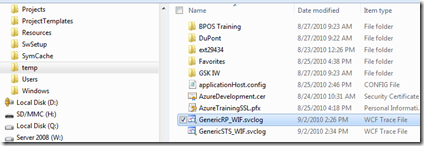
5. Go to the log file output location. Double click the log file to open the viewer.

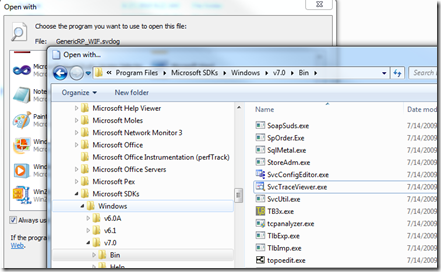
If the trace viewer is not already associated with the “svclog” file extension, you can manually associate it by right clicking the file and selecting the Open With menu option, as follows:
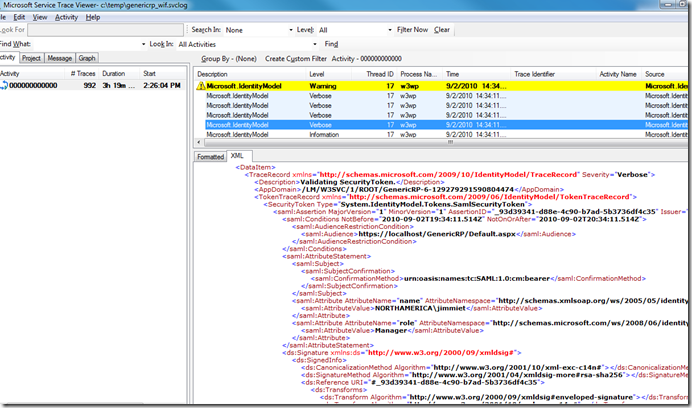
6. You can now use the trace viewer window to explore the events and resulting WIF traffic. I find the XML view the most useful. By clicking through the events in the upper pane, the lower pane shows the WIF generated artifacts. For example, you can explore the security token both before and after the encryption and signature are applied.
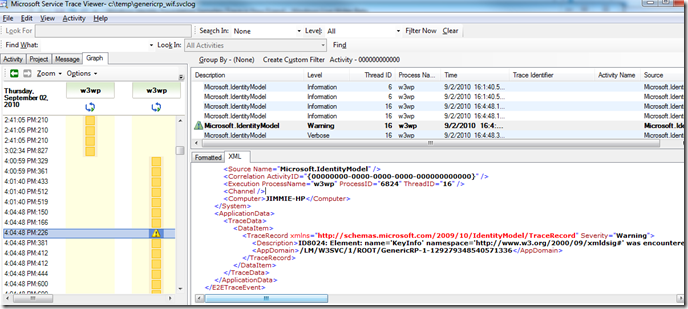
7. Sometimes interesting events can be spotted by switching to the Graph tab in the left panel. Here we see a warning that digest was not applied to one of the token elements.
I encourage you to experiment with WIF tracing and the service trace viewer. It is a great learning experience.
Technorati Tags: WIF,Service Trace Viewer


