More WMP play, Part I
Since Adam Nathan opened the door to using WPF controls in Windows Media Player, I've been itching to make some neat visualizers. This is something I've wanted to do for years, but the hardware requirements and the amount of effort to get a good payoff kept me from pursuing it.
Now it seems I'm at a happy confluence of events:
- Hardware is fast enough to do serious realtime signal processing in a visualizer;
- Software is sophisticated enough to describe visualizations in a powerful, high-level manner.
Point 1 is a Moore's Law thing; Point 2, of course, is WPF.
Check out what Nate Dunlap has put together for a WMP visualizer. I can hardly wait to see it running. Nate's apparently coming at the problem from the graphics design side, which is very encouraging and speaks to the effectiveness of Point 2.
So the first visualizer I've always wanted to code up is a uses an analysis method from nonlinear dynamics ("chaos theory") called a phase-space portrait. This graph, known for at least a century, plots a time-series signal X(t) against its time derivative X' = dX/dt. It turns out that this is a very revealing way to graph a complex dynamical system, and much of the study of nonlinear dynamics has benefited from the marriage of this venerable technique with computing power. Here's the phase-space portrait of the famous Lorenz system:
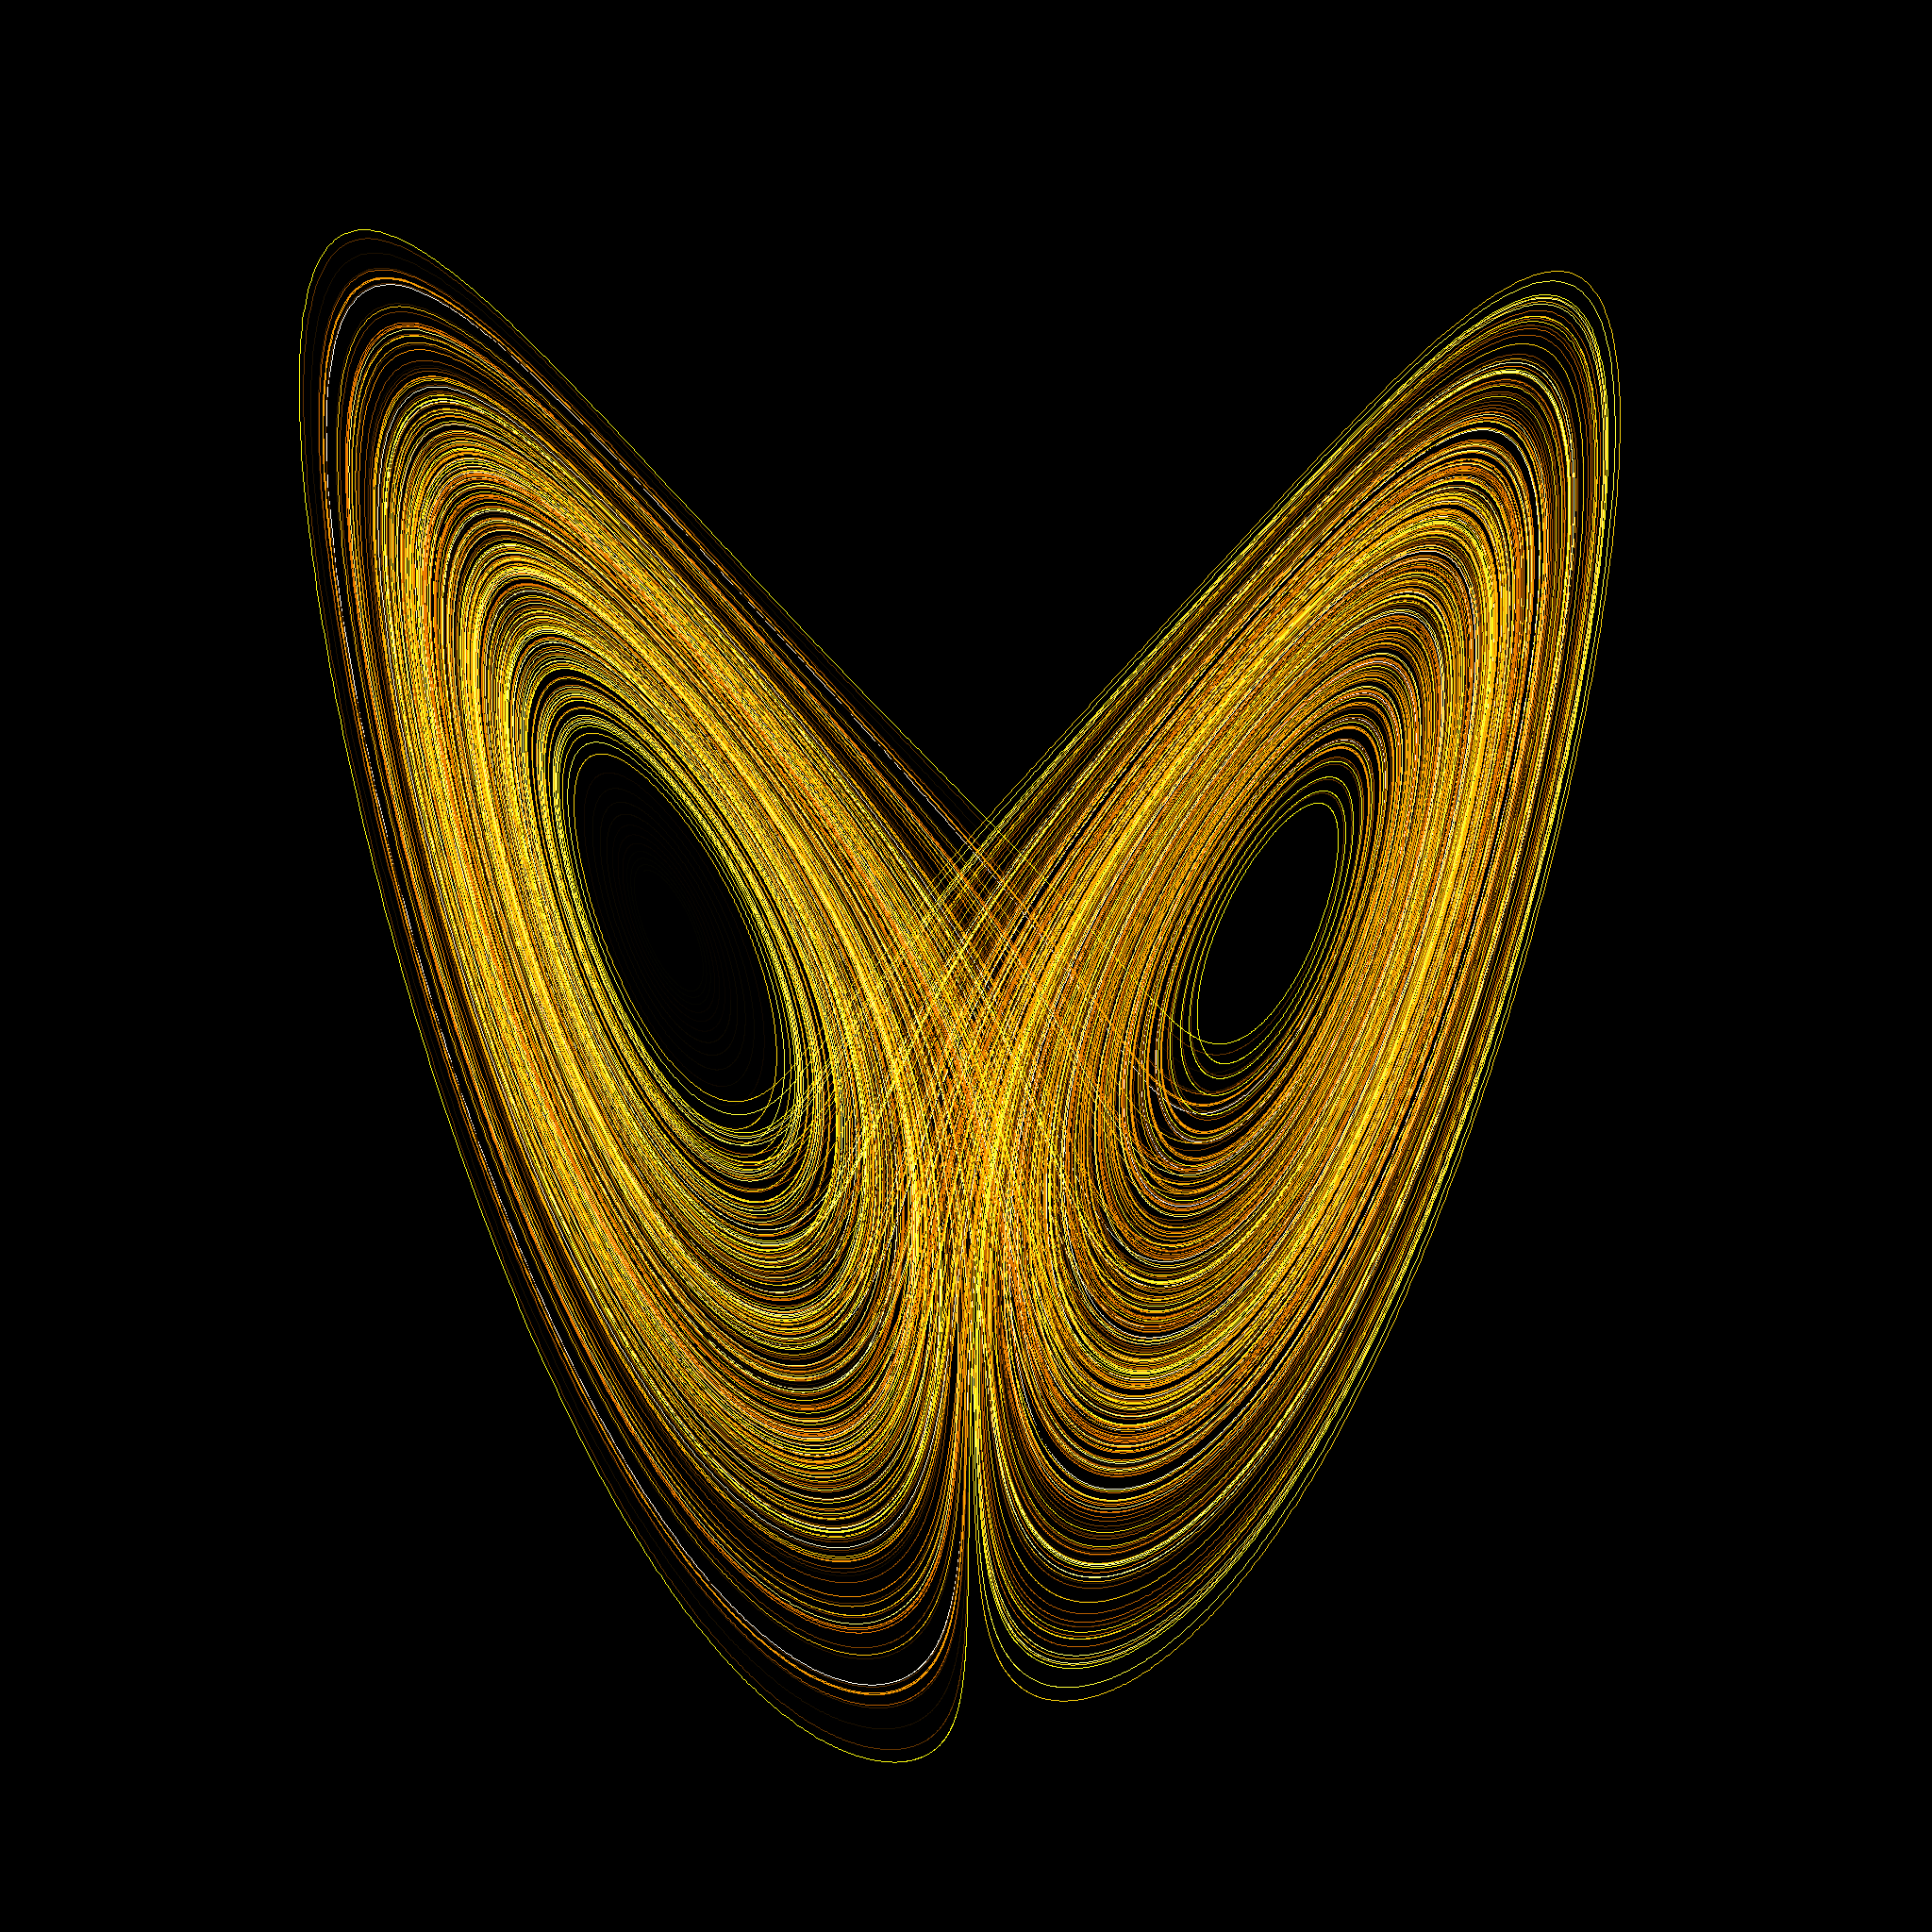
Lorenz attractor
Back in the day, my buds and I had a 7 mW HeNe laser, and we used it to create fun effects for the many, many parties at our place in Seattle's U District. One of the coolest projects involved two speakers, both with front-surface mirrors cleverly attached with balsa wood and silicone glue. The laser light reflected from the first mirror to the second mirror, and from there to the wall. The speakers were driven by the left and right channels from the amp, and there was enough phase delay between the two signals to produce interesting, Spirograph-like patterns (akin to Lissajous curves). It was a big hit. The challenge was to find music that produced the prettiest patterns. (Pink Floyd and Laurie Anderson worked well.) The Laser Fantasy folks at Seattle Center have built a small empire using this basic principle.
Fast-forward 15 years (ugh), and I can accomplish something very similar with digital technology replacing the analog technology. Windows Media Player provides a convenient platform for managing media, and it also gives me the time series and Fourier transform for free, which makes it a good place to start.
Using the Adam Nathan approach, I've already created "oscilloscope" and "spectrum" visualizers. Here's what my first attempt at a phase-space visualizer produced:
Phase space portrait from music
Sort of interesting, but it's not going to satisfy the ravers. This is created from the raw time series data, filtered by whatever filter the WMP graphic equalizer is applying. The most important issue is that the raw time series has a continuous spectrum filled with high frequencies. This makes the phase-space portrait look noisy. In the old analog laser system, we would fiddle with the equalizer to damp out a lot of high-frequency signal and boost the low-frequencies. This produced smoother but less rich patterns.
Because WMP gives us the spectrum for free, we can take a better approach. Which I'll describe in Part 2.