Cannot find the source of a SQL Server error ?
Ever had an error in your application and you couldn't find the source of all evil and where the error is thrown at the end ? Well, SQL Server profiler does a great job about that, but you really need to understand which events to filter for and how to correlate the results in order to know where to dig into. (I was inspired for this blog entry by Dirk van Coeverden, a colleague within MS who threw up this question on our internal alias list)
The sample I use using is straightforward and basically the same as questioned on the alias:
The conflict occurred in database "SchniggelBims", table "dbo.TheTable", column 'TheColumn.The statement has been terminated.RuleId:RuleIdHere. HealthServiceId:healthServiceIdHere. The INSERT statement conflicted with the FOREIGN KEY constraint "FK_Alert_BaseManagedEntity". The conflict occurred in database "SchniggelBims", table "dbo.TheTable", column 'TheColumn.
How to get the relevant Statement / Batch / procedure that caused the problem ? Well, the answer is SQL Server Profiler / server side tracing. Keep in mind that profiler might put additional pressure on your production system (depending on your current workload), instead of doing the graphical part, I will show you in a later post how to use the same functionality by doing a server side trace instead without profiler. This can be also useful for system NOT having SQL Server profiler at all, like SQL Server Express.
Turn on profiler (I will show that based on a blank template):
- Create a new trace
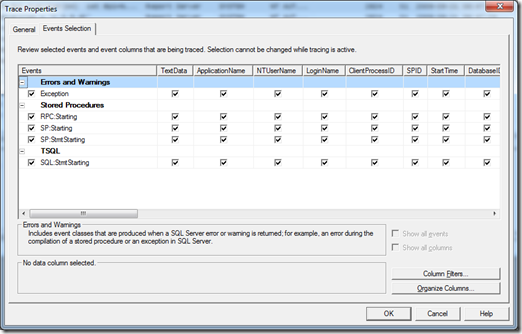
- Navigate to “Errors and Warnings” –> Check Exceptions
- Navigate to “Stored Procedures”
- Check “RPC:Starting”
- Check “SP:Starting”
- Check “SP:StmtStarting”
- Navigate to TSQL
- Check “SQL:StmtStarting”
(
Why do I have to check all that, shouldn't be RPC:Starting enough ?
Your are right, but…. In most cases you don´t know how the statement which caused the error was called ? By a parameterized procedure, from an adhoc statement… etc. You will have to differentiate between those:
- SP:StmtStarting
If you are looking for statements within a stored procedure executing, you will need to take a look at the Event SP:StmtStarting, bear in mind that parameterized queries will be still with the parameters. If the parameters are set from the calling procedure, you will also have to trace the RPC:Starting event.
- SQL:StmtStarting
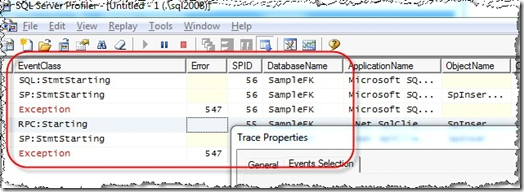
If you want to track the statements which are executed adhoc (e.g. starting the procedure with parameters from SSMS) you probably would need SQL:StmtStarting instead. (shown in the first error of the screenshot).
- SP:Starting
SP:Starting will be fired when a stored procedure is called, this can be based on external calls (like RPC but also internal calls, like when a procedure calls another procedure, so this can be useful if you have cascading calls.
- RPC:Starting
If you need the executing information of the RPC event (which is used by client libraries) you can use the RPC:Starting event (shown in the second error of the screenshot) This will also help you to get the parameters with which the procedure was called.
So based on your needs and workload on the server you might want to pick all or the specific events to be not overwhelmed from the information in Profiler.
)
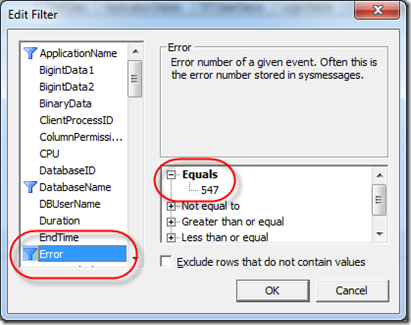
After setting the events you want to track, take a look at the filters. In many cases you already know the exception und error number and it might be easier for you to navigate the session stack if you look for the (red) exception message in profiler. For that case, navigate to Filters > Error Number > (Type in your error number here, in that case and example it’s 547, Foreign Key violation)
In addition and not to trace the whole server, implement a database filter to filter on events for the database you want to investigate.
(BTW, do you see the filter symbol on the Application Name ? SQL Server Profiler already filters it’s own events here like getting the trace data from the server. That is useful in 99.99% cases, so you should better leave that in. If you connect from your application with an application name, which can be set easily in the connection string properties you can also filter for your application name. If you do not set it and you connect using a .Net Application, you probably see something like in the screenshot telling that “.Net SqlClient…” is connecting.)
After starting the trace, you might see many traces coming in, more than actually the ones you are looking for, as SQL Server does not provide something like a flashback trace (Cool name, I should do a patent on that :-) ), meaning once the error occurred, get all the stack that the execution is built on and output this to the trace profiler. This is where your work begins, see the SPID column ? This is the one you should look for, you can easily walk up the stack using the SPID (SessionID) on your own finding the execution stack of the command that causes the issues. Once you found it, you can extract the information like parameters from here and rerun the query / or even debug it from SSMS.
Watch out for one of the next post where I adopt the information of this post for tracking triggers.
Any questions, suggestions or feedback. Feel free to drop me a mail or comment !
-Jens


