Parallel Programming in .NET 4.0: Parallel Tasks and Parallel Stacks windows in Visual Studio 2010
In Visual Studio 2010, there is new support for parallel programming as well. In particular, I want to discuss two new debugging windows, Parallel Tasks and Parallel Stacks.
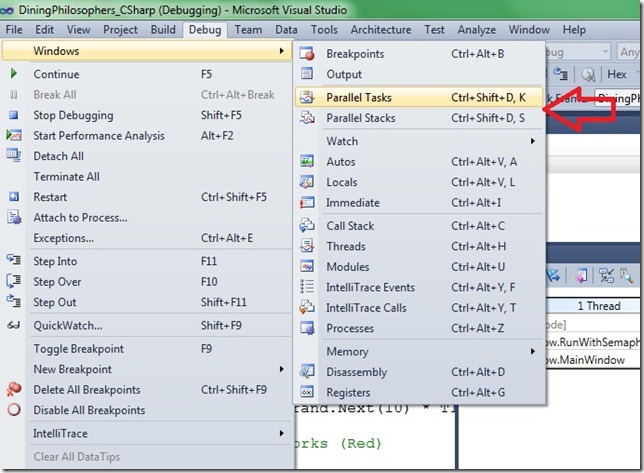
To access these windows, hit F5 in Visual Studio to run with debugging. Then click on the “Debug” menu item, select “Windows” and then click “Parallel Tasks” or “Parallel Stacks”.
Parallel Tasks
The Parallel Tasks window displays debugging information about each System.Threading.Tasks.Task (which we learned to use in yesterday’s post). This is very similar to the Threads window, except it is Task-centric rather than thread-centric. The information displayed includes flags, icons which indicate the current task and allow you to freeze/unfreeze tasks, a task ID, a task status (scheduled, running, deadlocked, or waiting), location, the task’s initial method with any passed-in arguments, the parent task, the task’s thread assignment, and the task’s AppDomain.
You can sort and group tasks using this window. There is also a Parent-Child view, where child tasks are displayed as nodes under their parents. You can also flag tasks by right-clicking on the task row and selecting “Flag”; you can then filter using flags to allow you to focus on just the flagged tasks. Finally, you can freeze the thread on which a task is running by right-clicking on the task row and selecting “Freeze Assigned Thread”; then that thread will not execute when you step through code (helping you to weed out the effects that various threads may be having on each other).
Parallel Stacks
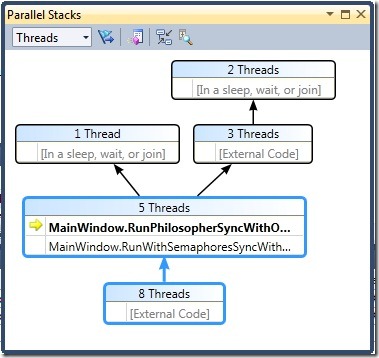
The Parallel Stacks window shows call stack information for all of your threads and Tasks. There is a dropdown menu in the upper left-hand corner to choose between the Thread and Task view. There are also toolbar icons to show only call stacks for flagged threads (which you can flag from the Parallel Tasks window), to toggle between Stack View and Method View, to autoscroll the diagram to the current stack frame, and to show/hide the zoom control.
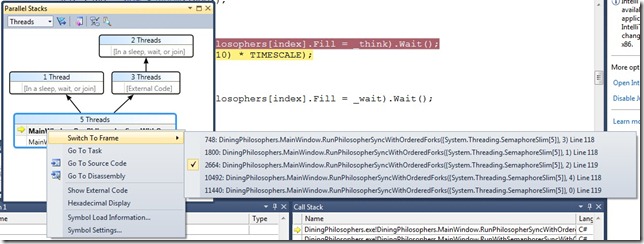
The call stack functionality that you expect is still in there. When you right-click the current thread, you will see the same functionality that you currently get in the Call Stack window: Go To Source Code, Go to Disassembly, Show External Code, Hexadecimal Display, Symbol Load Information, and Symbol Settings. In addition, you get two new items: “Switch to Frame” and “Go to Task”. “Switch to Frame” switches to the frame as you would in the Call Stack window, but in a parallel application, multiple frames may correspond to one method context so there are sub-menu items for each stack frame. “Go to Task” switches to the Task view (as the dropdown menu in the toolbar does), but it keeps the same stack frame highlighted.
To try out these windows for yourself, there is an awesome WalkThrough on Debugging a Parallel Application on MSDN.
I’ll complete this blog post series tomorrow, with a summary of the other support for parallel programming in the Visual Studio 2010 timeframe.


