Debugging JavaScript Add-Ins within Expression Web 4 from Visual Studio
Any add-in Author creating Expression Web 4 add-ins should be using the tools we have released to assist in development. One such tool is the Extensibility tester, that allows you to evaluate expressions and display return values from API calls, as well as displaying errors and events fired. Quite helpful. Another, the add-in builder, that builds out the manifest for an add-in, again quite helpful. Another is to cross reference JavaScript in released add-ins like SlapShot. Lastly we supply some documentation that is helpful in the new APIs we shipped in V4. The problem still exists that debugging JavaScript is rather old school (alerts, console, creating an error div and logging to it). What is really needed is a rich experience, something like the Dev ToolBar, Firebug, etc.
Fortunately we do have Visual Studio available, a debugger in which is quite helpful. This blog post will describe how to get Visual Studio and an Expression Web 4 add-in connected so you can use the rich JavaScript debugger in VS to help find and fix your bugs.
The first step is set Internet Explorer up for debugging. For background you should understand that add-ins within Expression Web run in a IE Web Control that Expression Web hosts. As with any web page (running in IE or an IE embedded Web Control) debugging is turned off from a Window installation. We will start with that as step 1.
1. Load Internet Explorer
2. Open IE Options
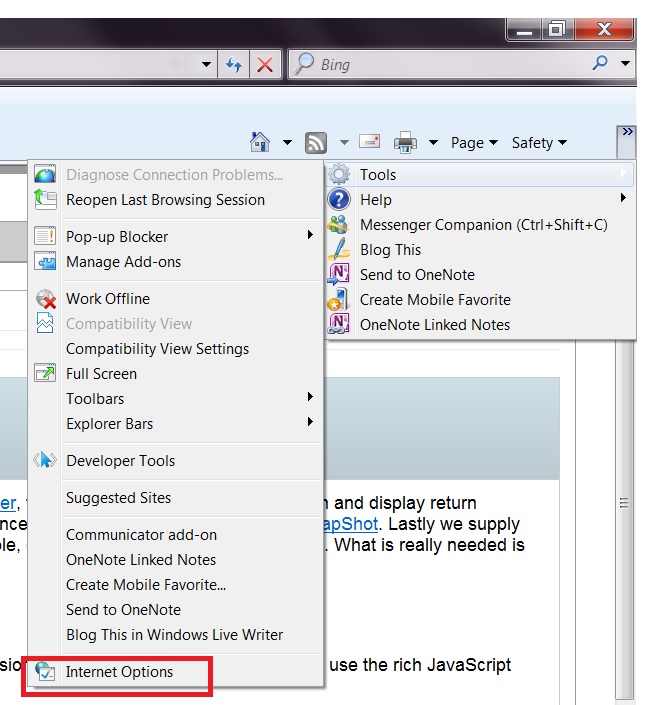
3. Click the Advanced Tab, locate the Browsing section and uncheck the 'Disable script debugging' checkboxes.
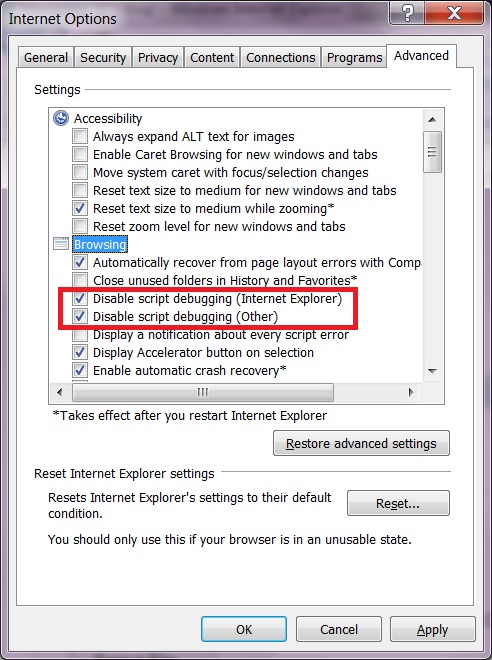
4. Click Apply, OK and close any and all IE instances, as well as all Expression Web instances.
IE is now ready to have Visual Studio attached and script debugging can commence with the JS script debugger. We will not go into that today as we want to explore how to script debug Expression Web JavaScript add-ins. To do that start by loading Visual Studio. Make sure the add-in that you want to load up and debug is installed into Expression Web 4. For this example we will use SlapShot. I'd suggest downloading and installing it now if you are following this tutorial (versus just reading).
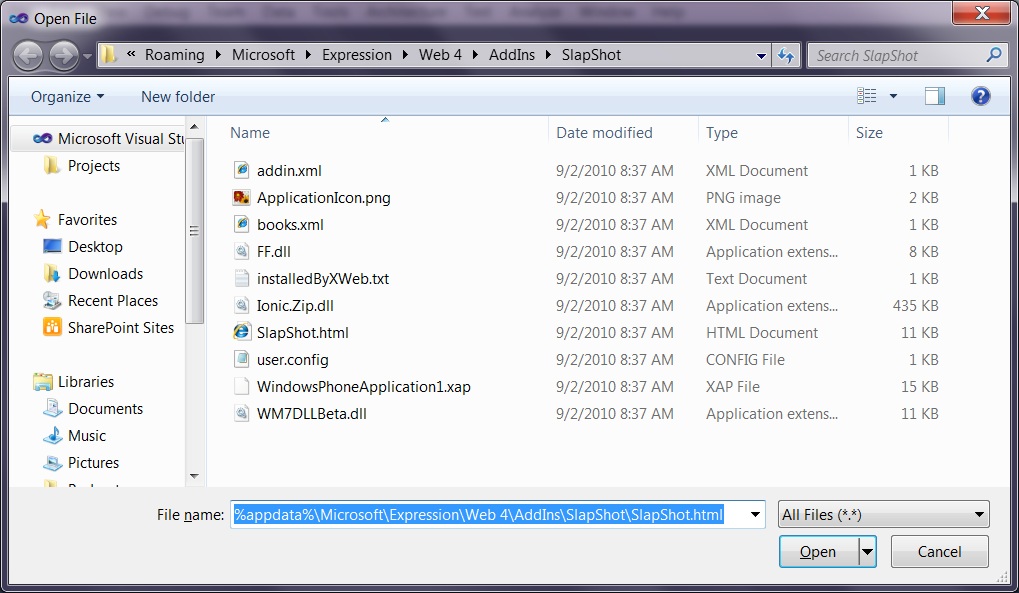
With Visual Studio launched and SlapShot installed open SlapShot.html from your add-ins directory within VS:
1. In VS choose 'File Open -> File' and use %appdata% directy ala: %appdata%\Microsoft\Expression\Web 4\AddIns\SlapShot\SlapShot.html
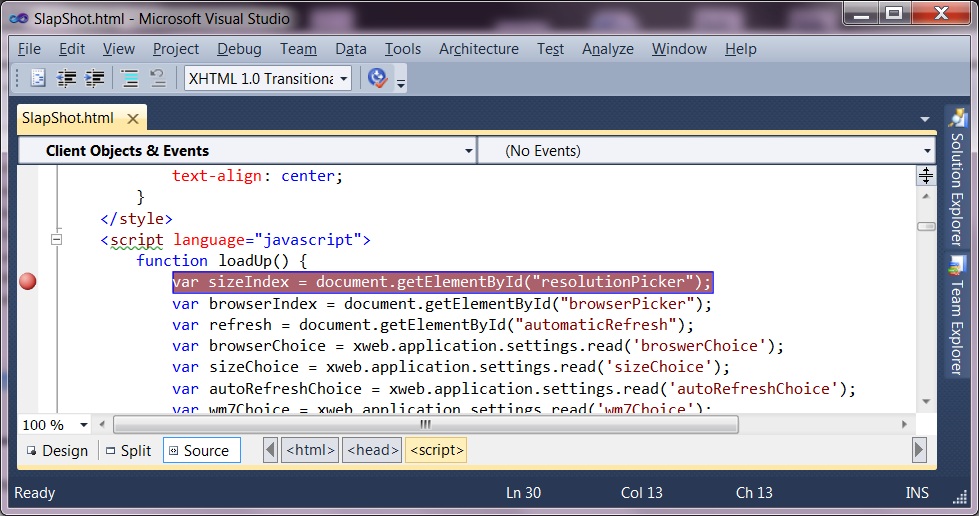
2. Once open in VS find and place your cursor on line 30, then press F9 to insert a breakpoint:
3. Start Expression Web 4 (if SlapShot is open close it and restart Expression Web). Create a website, configure it to use the Dev Server, run any page one time in IE (F12).
4. Back in VS use Debug ->Attach to process, find expressionweb.exe and click it once:
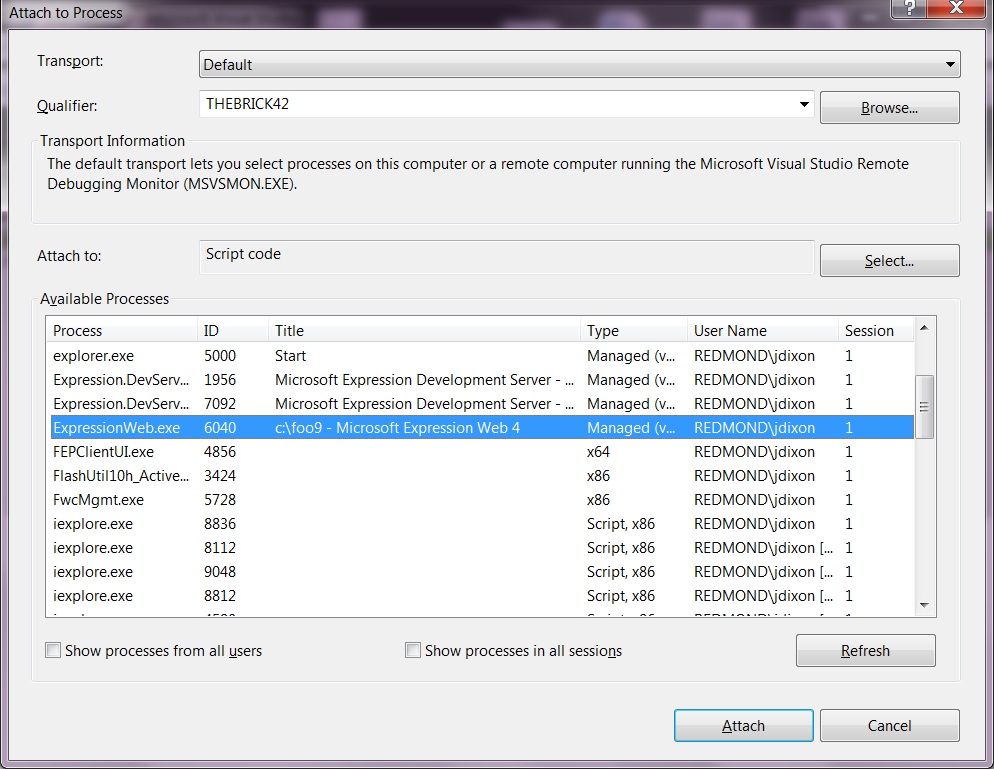
5. Next click the 'select' button, choose the 'Debug these code types' radio and choose 'Script', uncheck all others
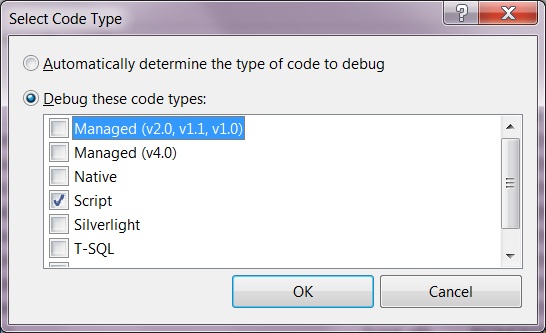
6. Click OK and then attach, back we go to expression Web 4, time to load SlapShot up.
7. Choose the Panels menu and choose SlapShot
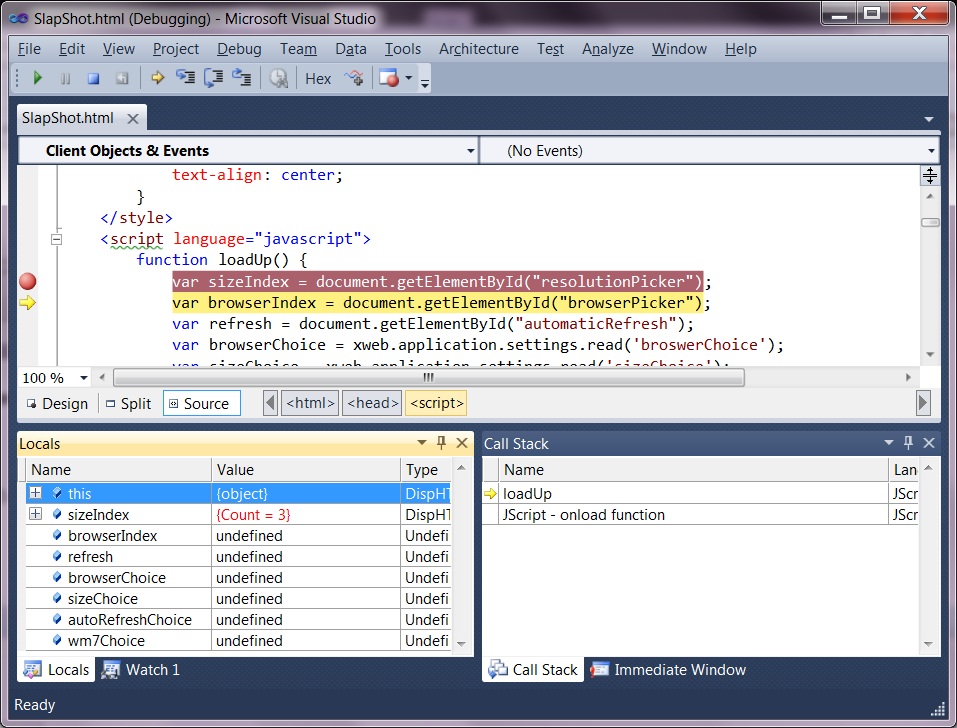
8. You should cleanly break into Visual Studio at your breakpoint, hit F10 once and you will start to see your locals populate with data, your call stack window showing your stack (nice):
Some nice thoughts here are that you can inspect some of the less documented objects within the API:
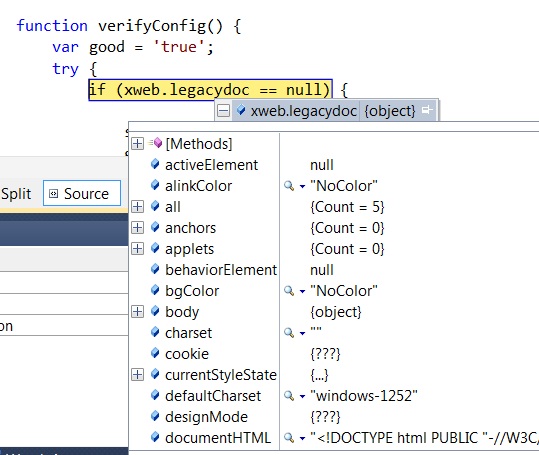
Sweet, locals, watch, callstack, function eval and object inspection. Enjoy, any problems let me know!
John