Introducing the managed debugger
One of the most exciting features in Speech Server 2007 is the SDK. The SDK is dramatically improved over Speech Server R2 and contains several new tools and scores of new features. Some of the features I am still unable to discuss but one that I can discuss, and one that I think is the most exciting, is the managed debugger.
If you have used a previous version of Speech Server, you many have found the debugger a little frustrating. The truth is the debugger wasn't that bad - debugging an application that is created as a web page is. Some of your code would be on the server side while some is on the client and the concept of stepping through your app did not really exist.
It makes much more sense to just create a managed app and step through it like you would with any other app and this is exactly what the managed debugger does. The great thing about this feature is if you have already used the debugger in VS 2005 (which I assume you have) then you will feel right at home. Breakpoints, call stack, watch window - they're all there and work the same as any other managed app.
I would love to be able to show you some screen shots of the debugger but unfortunately this blogs site is a great example of bad usability design and I have been unable to figure out how to include images. When I do I will add them in another post. I have attempted to add an attachment to this post which you may or may not see.
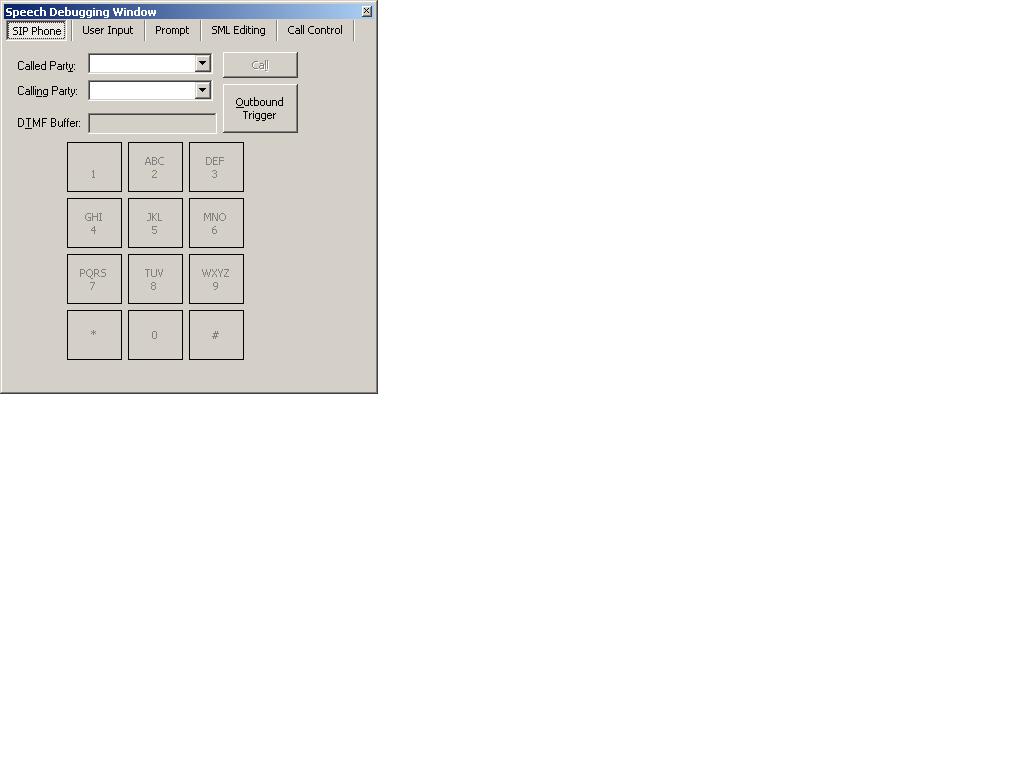
To start the managed debugger, simply press F5. CTRL+F5 (start without debugging) also works, though you will obviously not be able to set breakpoints and you will only be able to use audio input. After pressing F5, you will see the SIP Phone window. This acts as a SIP soft phone to communicate with the application.
The SIP Phone window will contain between one and five tabs. When using CTRL+F5, only the first tab is visible.
SIP Phone tab - contains dropdowns for entering the calling and called party numbers and buttons to generate an incoming or outbound call. It also contains DTMF keys for entering DTMF responses to grammars.
User Input tab - contains controls for responding to a grammar. You can respond in the following ways
Text input - type in a response which will be sent as text and will bypass speech recognition
Wave input - send a wave file that has a response prerecorded
Voice input - speak into the microphone similar to the way users would interact
Error emulation - This allows you to emulate several different errors such as initial silence and no grammar reco.
Prompt tab - displays the prompts that are played by the app with full SSML and contains an option to play the audio of the prompt
SML tab - This is the SML editing feature from R2 and is only used for VXML and SALT applications. For managed applications you can modify the SML from a response as you would any other variable in VS.
Call flow - This displays CSTA messages from SALT application
One other nice thing is the debugger is basically the same (plus or minus 2 tabs) whether you are working on a SALT, VXML, or managed app. This is one benefit we get from having a single managed core, with SALT and VXML interpreters built on top of it.
In my blogs next week I will continue with discussing the Core API including such topics as outbound calls, DTMF and speech reco, prompts, and call transfer. There is a great deal of material to go over so if you have anything specific you would like to see please add a comment and I will write on that sooner rather than later.