SQL Server Profiler and SPQuery
Question: I’m using SPQuery to retrieve items from my SharePoint list and now I want to know little bit more about SPQuery properties. Actually I’m interested about performance related things since I’m not sure about my query currently. I currently have following code to retrieve my data:
|
|
Answer: To answer this question I need to step into dark side for a minute... I mean that I’m going to ask you to play with SQL Server Profiler to analyze your query more closely. This is of course to give some ideas how to tune your query using query properties and nothing else. I don’t want you to start use any custom SQL queries or other weird hacks that you might come up. Just tune the query and that’s it.
NOTE: Do this stuff only in you own dev box. Don’t even think anything else.
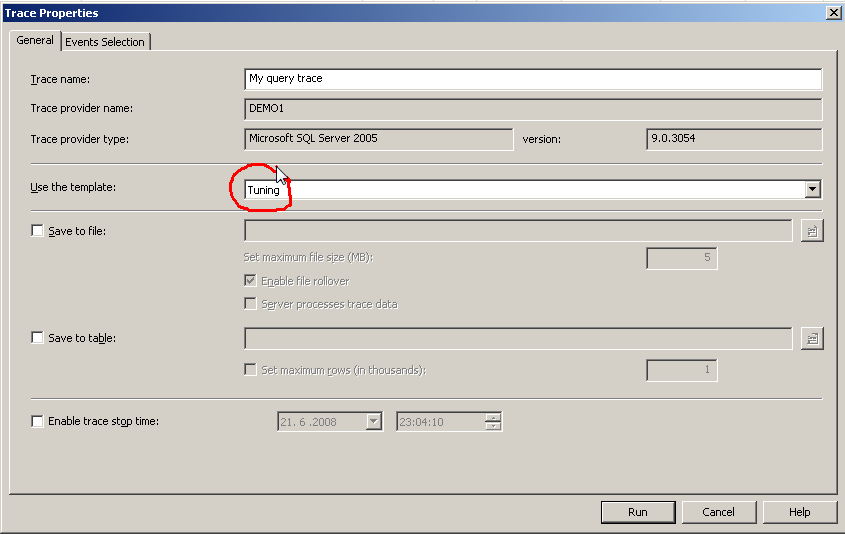
Before we start using the SQL Server Profiler you might want to stop SharePoint related services so that it’s easier to read the SQL trace. I’ve stopped IIS Admin (+related), Office SharePoint Server Search and Windows SharePoint Services* . Now you can start SQL Server Profiler and you’re ready to start tracing. Just create new trace (File->New Trace...) and select Tuning for your template:
And if I now run your query I’ll get something like 200+ rows in my trace window. But you’re probably just interested for the rows that tell what is going on. If you pause the trace after the query then it’s most likely the last line in the grid:
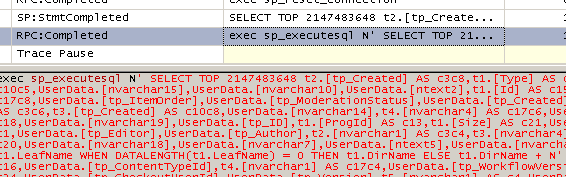
It gives you fairly long SQL (mine was ~4500 characters long) and it’s not trivial to understand what it is really doing.
But first you probably notice the interesting SELECT TOP 2147483648 ... And that’s the first thing you might want to change (of course you know best what you’re trying to achieve). But for that you have property called RowLimit. So if you add “query.RowLimit = 10;” to your code and re-run the trace you get following output:
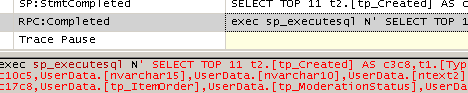
So now you have SELECT TOP 11 ... which is better (note that the actual limit is your RowLimit + 1). If you only need to display n rows from database then don’t retrieve all and display just n => Use RowLimit to narrow down the resultset.
Next thing we need to take into consideration is ViewFields. If I know that I’m only going to show Title, then why should I need to retrieve more fields. Let’s narrow down the fields using ViewFields:
|
|
And again let’s test the trace and compare the query for the first trace. You may notice that the SQL is only ~3000 chars long anymore and amount of columns at the resultset is a lot less (screenshot from management studio when both queries have been executed):
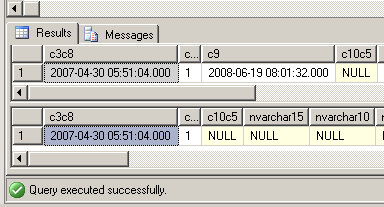
Notice the size of scrollbar…. larger is better :-)
Now I have just added few lines of code and the result is ~1500 shorter SQL and we’re only getting the amount of rows from DB that we need to. I’m not going to play with another properties but if you’re interested you might want to start with Include* properties.
I showed small example that how can use SQL Server toolset to verify (at least for some extend) that your queries are going for the right direction.
Anyways... Happy hacking!
J