Those kids won't eat anything!
I did my BI Power Hour demo at PASS 2008 yesterday and it featured my twin boys Bowen and Logan. 
Logan (right) has an ASD (Autism Spectrum Disorder) that limits his diet (no milk products, gluten, or soy) and Bowen has some sensory issues, but that doesn't explain their extreme pickiness with food. For example, I made a rice-yogurt-blueberry smoothie for Logan and he just looked at it and said "yucky!". Ugh.
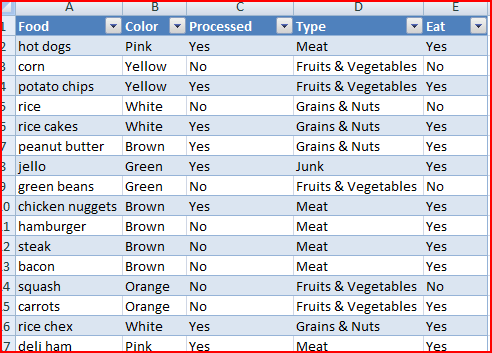
So, I decided to make a worksheet listing foods they these kids will eat and won't eat. I used attributes of Color, Type, and Processed, along with a column indicating whether or not they will actually eat the food. Of course, I had to answer to myself disturbing questions such as "what color are hot dogs?", but I got through it.
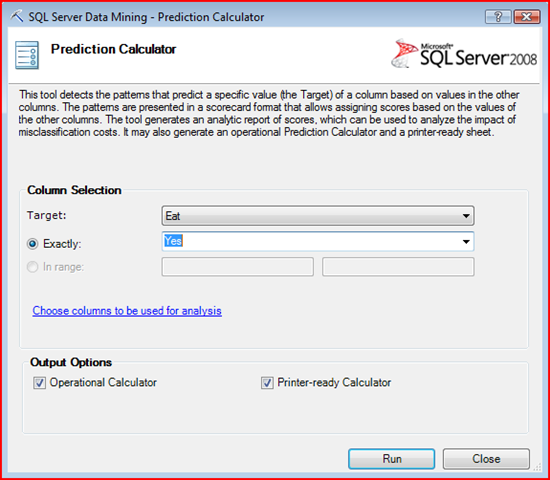
Then I used the Prediction Calculator from the new Table Analysis Tools Excel addin for SQL Server 2008. The Prediction Calculator creates a little widget in Excel that allows you to enter in input values and based on your costs. Running the Prediction Calculator is as simple as selecting your table, clicking the Prediction Calculator button on the Table Analyze ribbon, and then choosing the column and value you want to predict.

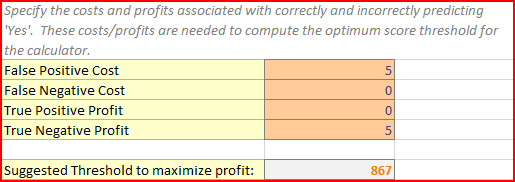
There's actually a little more work to do after you run the tool, and that is specifying your costs and profits. Your costs are the cost you incur for getting the answer wrong, and a profit is the profit you make when you get the answer right. The grid below is in Prediction Calculator Report that is created after running the tool. In this case, I figured that if I guessed that my kids would eat some food and was wrong, it would cost me the 5 bucks for the food which would be wasted, therefore I set the False Positive Cost to 5. Furthermore, I figured that if I guessed correctly that they wouldn't eat a food, I saved the money and the 5 bucks would still be in my pocket, so I set the True Negative Profit to 5 as well.
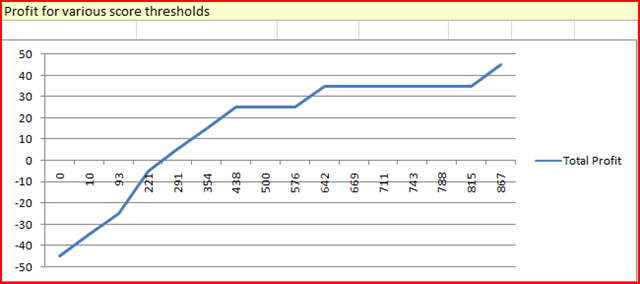
Doing so, gave me a profit chart that looks like below - which is a problem. Basically, what a "always rising" chart says is that you should always say "no" to achieve the highest profit - which makes sense since I can only lose money by saying "yes" and only gain money by saying "no". Essentially my laptop analysis tells me that my kids are simply too picky and I should just make them starve! Hah! My laptop apparently has never had kids!
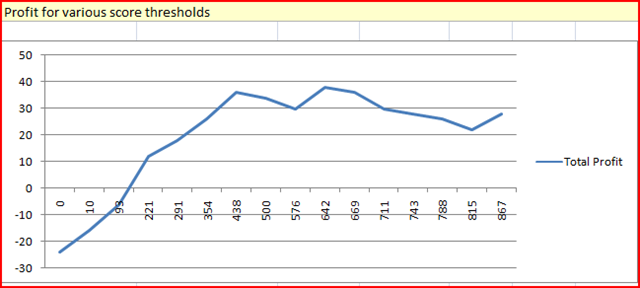
Anyway, I decided that there's some nominal value for my kids eating, so I changed the parameters a bit. I figured that my kids complaining that I didn't get a food that they wanted causes me the psychological cost of 1 dollar (or maybe the real cost of going back to the store of a dollar, however you want to see it), and I set the False Negative Cost to 1. Also I decided the value of my kids not getting a sugar imbalance and (literally) bouncing off the walls is a "peace of mind" profit of a dollar, so I set the True Positive Profit to 1 as well. This gives me a better behaved profit chart with a peak like below.
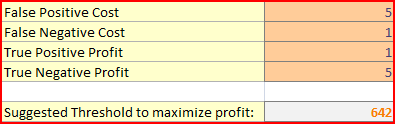
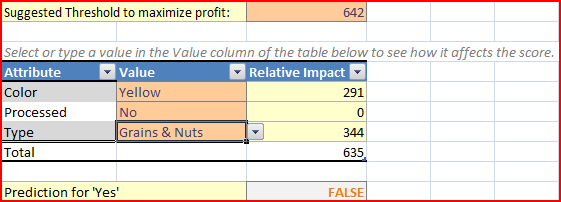
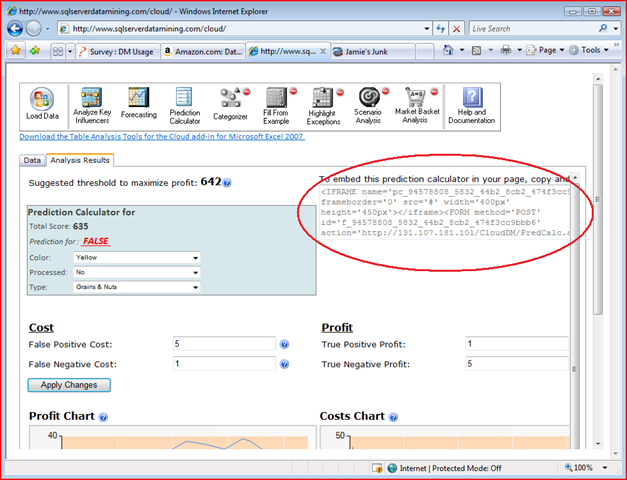
Once I've set my costs, I can go to the Prediction Calculator sheet that was created and select my inputs and see if my kids will actually eat the food. In this case, "Yellow, unprocessed, grains and nuts" doesn't exceed the threshold of 642, so the answer is no. Yay! I saved 5 bucks because my kids won't eat corn :(.
Of course, this isn't very useful for me in this format - it's not like I'm going to lug my laptop around the grocery store plugging in values for every product I see on the shelf. So to get around this I use the new, experimental Cloud Data Mining Service . The web interface contains many of the Table Analysis Tools, including the Prediction Calculator, and you can access data from CSV files, SQL Data Services, or another way which is not entirely obvious and not documented by simply pasting your data from Excel to the web.
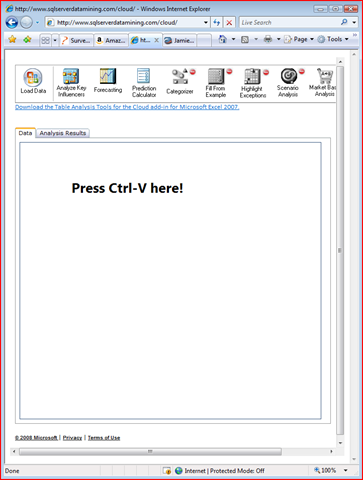
Once you've pasted your data, I run the Prediction Calculator just like I did in Excel. There's one small difference, however, in the result is that I have the HTML fragment for the calculator itself. Therefore I can make my own web site with the calculator embedded inside.
Once I have my website (which in this case is at
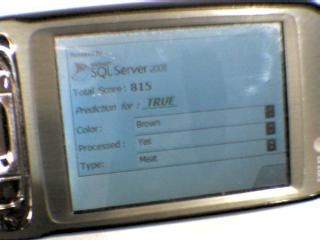
https://www.sqlserverdatamining.com/PASS2008BIPowerHourDemo.htm) I can access the Prediction Calculator from any web-enabled device - like my phone, which I can carry around the grocery store and determine that my kids will eat .... brown.....processed.....meat.... oh yay....