TFS 2013 Update 4 Trend Charts
TFS 2013, the gift that just keeps giving. With the latest Update 4, now RTM'd - see Brian Harry's blog here: https://blogs.msdn.com/b/bharry/archive/2014/11/12/news-from-connect.aspx we now have Trend Charts within TFS Web Access. Previously to get Work Item trend reports you had to use the TFS Analysis Cube and use either the out of the box SSRS reports or roll your own. Now, you can create simple charts based off of Work Item Queries that show off your data over time. Let's have a quick look at what this looks like.
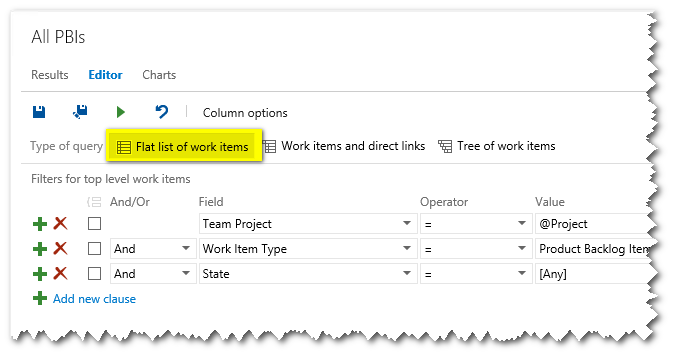
To create a Trend Chart you must start from a flat work item query eg:
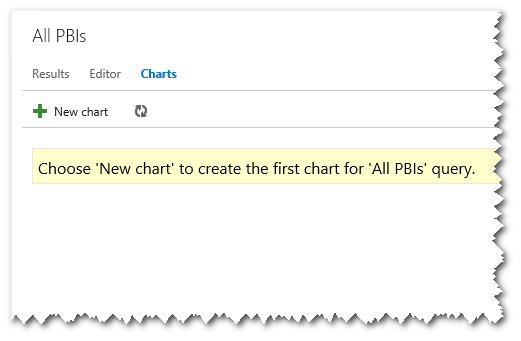
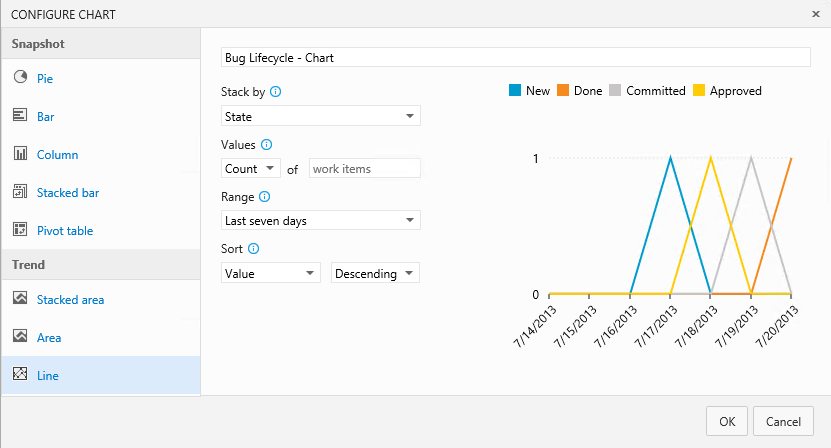
Once you've got your filter criteria set out, you can then select Charts in the tab heading. This will bring up the dialog to create a new chart:
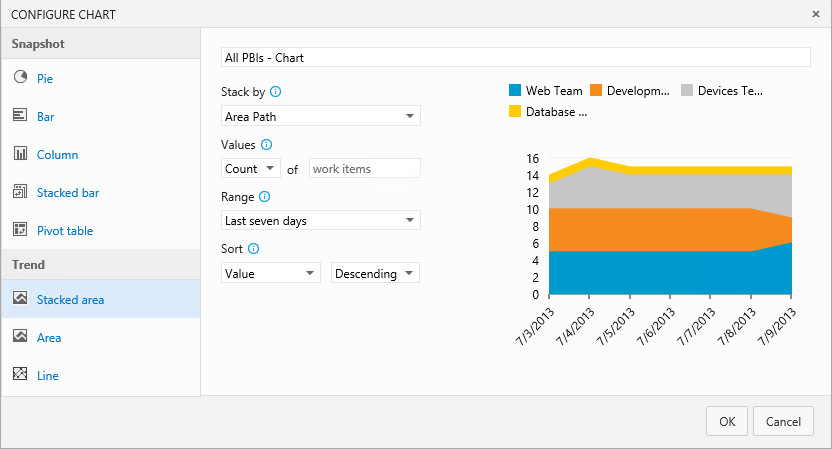
Select the obvious, then you can choose which type of chart you want: Stacked Area, Area or Line eg:
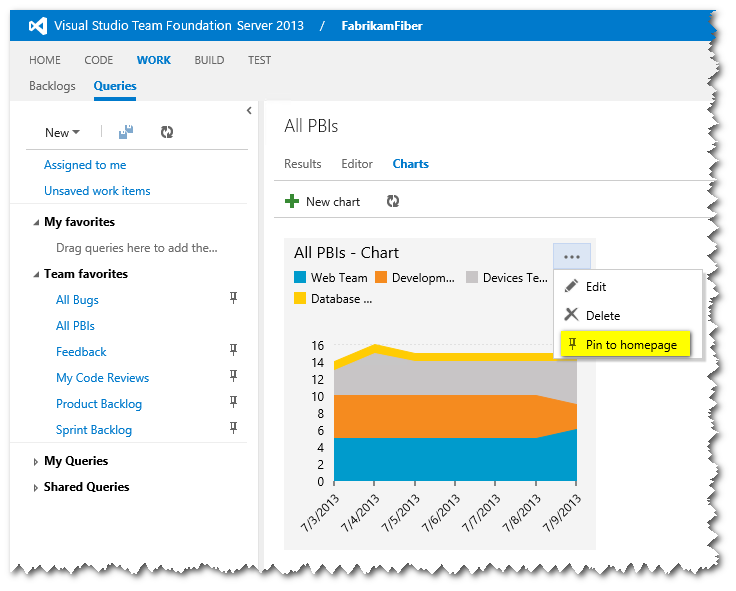
Once you've got your chart looking how you want it, you can then save it and pin to the main dashboard (to do this you're Work Item Query must be a Shared Query and in the Team Favourites):
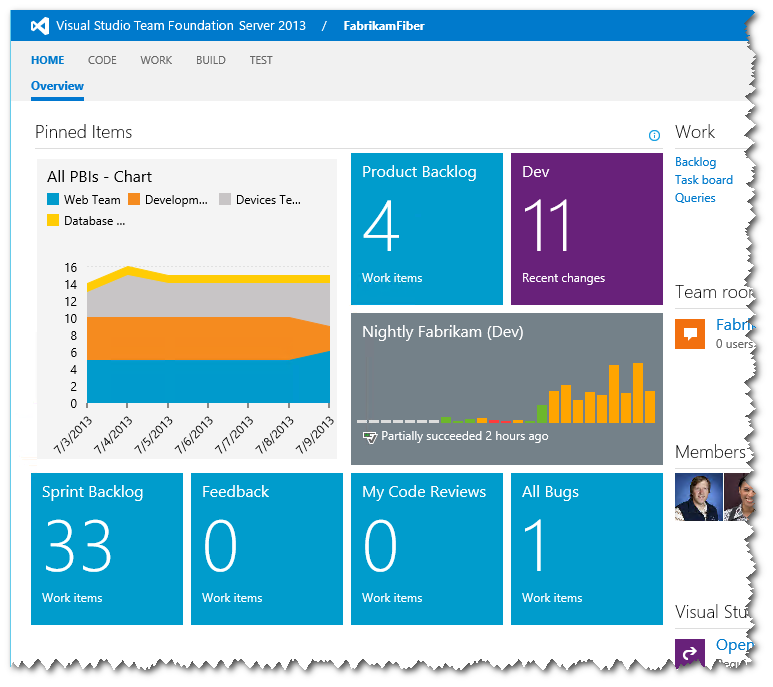
Then navigate to your dashboard:
Now let's look at some fun stuff you can have with this new feature. If you take a typical lifecycle for 1 TFS Work Item Bug:
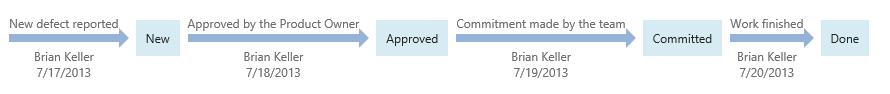
But now want to graph this over time, you can do this:
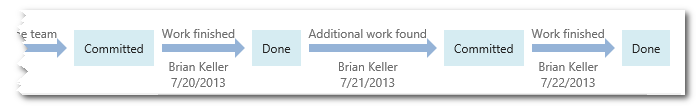
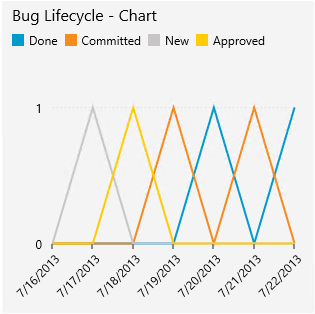
Now, lets say we want to look a bug that has been re-activated (re-opened since being closed, eg. re-occurring bugs) then fixed again, it's lifecycle would be the same as previous, but extended to look like this:
And we can now graph this as:
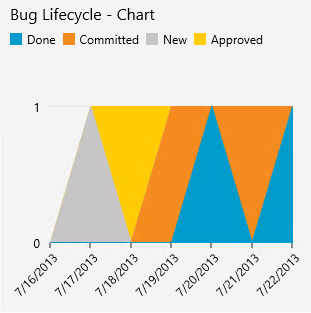
We can also present this as a Stacked area chart:
That was analysing just 1 bug and it's status over time. However, more realistically you'll be tracking more than 1 bug. So let's load up TFS with some more realistic data:
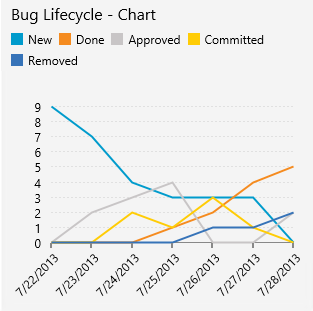
Now let's step through to understand this better:
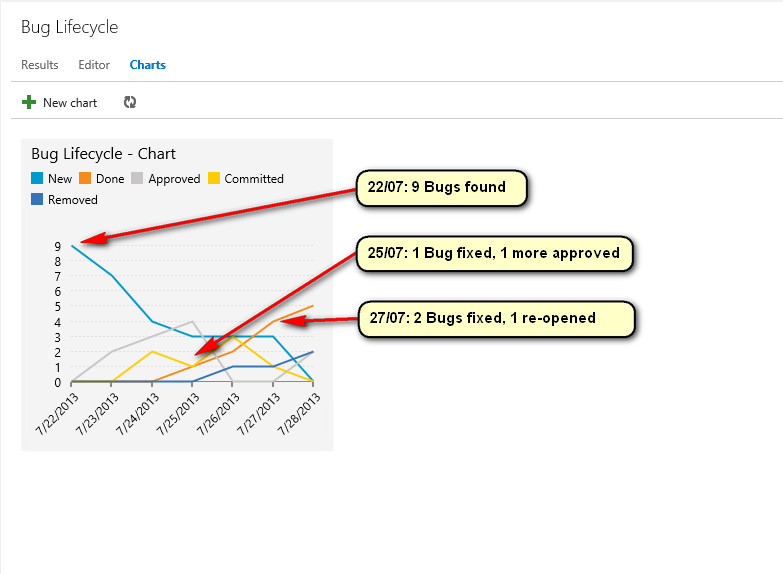
Some of the events have been annotated over the graph. But the complete sequence is as follows:
- 22/07: 9x new bugs added
- 23/07: 2x bugs were approved
- 24/07: 1x bug approved (now total 3) and 2 committed
- 25/07: 1x bug done and 1 approved (now total 4)
- 26/07: 3x committed, 1x removed and 1 done (now total 2)
- 27/07: 2x done (now total 4), 1x committed (re-opened)
- 28/07: 1x done (now total 5), 2 approved and 1 removed (total 2)
Hopefully this gives you an idea of how you can now report on TFS Work Items over time.