how to collect data for troubleshooting SQL Servers via sqldiag
Nowadays, I am reviewing the tools for troubleshooting SQL Servers since I will deliver a training in Dublin next week. While reviewing them, i would like to summarize them with a blog series. Now, first one is SQLDiag. SQLDiag is a general purpose diagnostics utility that can collect the following types of diagnostic information:
Windows performance logs
Windows event logs
SQL Server Profiler traces
SQL Server blocking information
SQL Server configuration information
It is a utility coming with SQL Server installation by default. And the default path for the exe file is C:\Program Files\Microsoft SQL Server\110\Tools\Binn for SQL 2012. For the first time please just run the exe to create necessary files and folders:
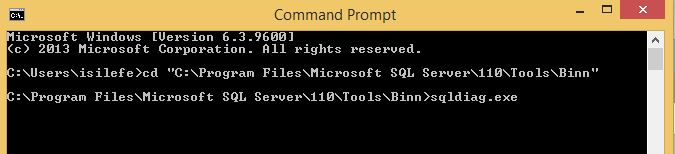
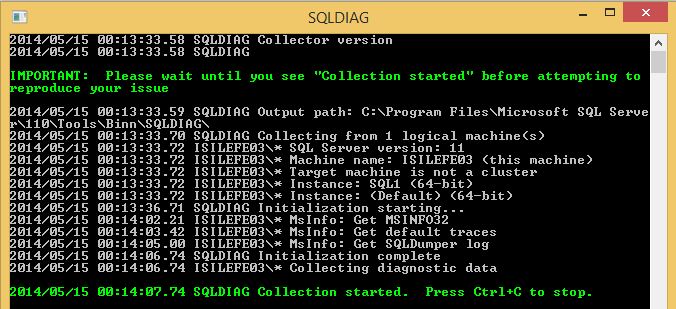
Wait until you see the green line and press Ctrl+C.
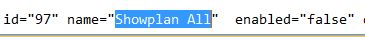
Under Binn folder, there is a new file created called SD_Detailed.xml which is used to configure which issues to collect. This file can be copied and the new file can be edited to keep the default configuration file as it is. I have just copied it and renamed the new file as SD_Detailed_test.xml. And just edited ShowPlan All event as true to be able to view query plans of the collected trace. Please be careful in your live systems with the expected performance impact of ShowPlan All event.
The next step is running the sqldiag utility with the recently configured file properties. To be able to run SQLDiag with the new input file, I have used /I parameter. For the set of parameters please review: http://technet.microsoft.com/en-us/library/ms162833(v=sql.110).aspx

It will ask you to overwrite the output folder, I have just type "Y" in my case. With the green line, it will warn you when it starts to collect data. I have run a workload here to have more meaningful data but in your live systems you will have already meaningful workloads :)
All collected data will be stored under C:\Program Files\Microsoft SQL Server\110\Tools\Binn\SQLDIAG folder:
--Files with .trc extensions are the sql profiler trace file giving information to analyze queries.
--Files with .blg extensions are the performance monitor files giving information about the configured performance counters.
--File with .log extention shows the error log information.
--File having "ms_info32.txt" in its name, shows system configuration information.
Now, we have collected many data to be analyzed, analyzing by eye and each file one by one could be an option of course however it could be a waste of time.
I will write about analyzing tools in my next blog posts. please hold the line :)
Işıl