collecting performance data for SQL Server via Powershell
Performance Monitor is a Windowds-based tool which has also very effective counters for SQL Server. There are various methods to collect performance data like typeperf (http://technet.microsoft.com/en-us/library/bb490960.aspx)
and creating data collector sets (http://technet.microsoft.com/en-us/library/cc722414.aspx). Another method is using Powershell script. Here you go with the script:
#In do-while loop, you can define how many times you would like to run the script with one execution. <br> #Get-Counter cmdlet has -max samples parameter as well, however if you set it a value other than 1 then<br> #it waits until the end of the script to write the database after collecting all samples.<br> #With the logic of do-while loop I managed to write the database after each sample collection.<br> $a = 0 <br> do<br> {<br> #$server variable defines the server to be monitored<br> #if you would like to monitor more than 1 server you can use Get-Content cmdlet as shown below:<br> #$server = @(get-content "C:\perfcounter_ps\AllServers.txt")<br> $server = 'ISILEFE03'<br> #$monitorServer variable defines the server that we are collecting data on and $monitorDB variable defines<br> #the database that we are using like a datawarehouse<br> $monitorServer = "ISILEFE03" <br> $monitorDB = "testperf" <br> $counters = @("\Memory\Available MBytes",<br> "\Memory\Pages/sec",<br> "\PhysicalDisk(_Total)\Avg. Disk sec/Read",<br> "\PhysicalDisk(_Total)\Avg. Disk sec/Write",<br> "\PhysicalDisk(_Total)\Current Disk Queue Length",<br> "\PhysicalDisk(*)\Avg. Disk sec/Read",<br> "\PhysicalDisk(*)\Avg. Disk sec/Write",<br> "\PhysicalDisk(*)\Current Disk Queue Length",<br> "\Process(sqlservr)\% Privileged Time",<br> "\Process(sqlservr)\% Processor Time",<br> "\Processor(_Total)\% Privileged Time",<br> "\Processor(_Total)\% Processor Time",<br> "\SQLServer:Buffer Manager\Buffer cache hit ratio",<br> "\SQLServer:Buffer Manager\Lazy writes/sec",<br> "\SQLServer:Buffer Manager\Page life expectancy",<br> "\SQLSERVER:Memory Manager\Memory Grants Pending" ,<br> "\SQLServer:SQL Statistics\Batch Requests/sec",<br> "\System\Context Switches/sec",<br> "\System\Processor Queue Length" <br> ) <br> $sequence=1 <br> $collections = Get-Counter -ComputerName $server -Counter $counters -SampleInterval 10 -MaxSamples 1<br> Write-Output $collections <br> foreach ($collection in $collections) <br> {$sampling = $collection.CounterSamples | Select-Object -Property TimeStamp, Path, Cookedvalue <br> $xmlString = $sampling | ConvertTo-Xml -As String<br> #dbo.usp_InserPerfmonCounter is the stored procedure that is used to insert collected data to testperf database<br> $query = "dbo.usp_InsertPerfmonCounter '$xmlString';" <br> Invoke-Sqlcmd -ServerInstance $monitorServer -Database $monitorDB -Query $query<br> Write-Output $sampling<br> $sequence+=1}<br> #Write-Output $sampling <br> #Write-Output $xmlString <br> #Write-Output $query <br> $a+=1<br> Write-Output $a<br> }<br> while($a-lt 10)
The script for the stored procedure dbo.usp_InsertPerfmonCounter is:
(refering http://www.travisgan.com/2013/03/powershell-and-performance-monitor.html)
 USE [testperf]
 GO

 /****** Object: StoredProcedure [dbo].[usp_InsertPerfmonCounter] Script Date: 11/5/2013 11:27:48 AM ******/
 SET ANSI_NULLS ON
 GO

 SET QUOTED_IDENTIFIER ON
 GO

 CREATE PROCEDURE [dbo].[usp_InsertPerfmonCounter]
 (
 @xmlString varchar(max)
 )
 AS
 SET NOCOUNT ON;

 DECLARE @xml xml;
 SET @xml = @xmlString;

 INSERT INTO [dbo].[PerfmonCounterData] ([TimeStamp], [Server], [CounterGroup], [CounterName], [CounterValue])
 SELECT [Timestamp]
 , SUBSTRING([Path], 3, CHARINDEX('\',[Path],3)-3) AS [Server]
 , SUBSTRING([Path]
 , CHARINDEX('\',[Path],3)+1
 , LEN([Path]) - CHARINDEX('\',REVERSE([Path]))+1 - (CHARINDEX('\',[Path],3)+1)) AS [CounterGroup]
 , REVERSE(LEFT(REVERSE([Path]), CHARINDEX('\', REVERSE([Path]))-1)) AS [CounterName]
 , CAST([CookedValue] AS float) AS [CookedValue]
 FROM
 (SELECT
 [property].value('(./text())[1]', 'VARCHAR(200)') AS [Value]
 , [property].value('@Name', 'VARCHAR(30)') AS [Attribute]
 , DENSE_RANK() OVER (ORDER BY [object]) AS [Sampling]
 FROM @xml.nodes('Objects/Object') AS mn ([object])
 CROSS APPLY mn.object.nodes('./Property') AS pn (property)) AS bp
 PIVOT (MAX(value) FOR Attribute IN ([Timestamp], [Path], [CookedValue]) ) AS ap;

GO
And here is the script of the table that I used.
 CREATE TABLE [dbo].[PerfmonCounterData]
 (
 [ID] [bigint] IDENTITY(1,1) NOT NULL PRIMARY KEY CLUSTERED,
 [Server] [nvarchar](50) NOT NULL,
 [TimeStamp] [datetime2](0) NOT NULL,
 [CounterGroup] [varchar](200) NULL,
 [CounterName] [varchar](200) NOT NULL,
 [CounterValue] [decimal](18, 5) NULL
 );
 GO
And then when we run my script with the command below on Powershell, we can check the result from our table
for inserted data.The result is written for every 10 sec as we expected since sampleinterval parameter is 10 sec
for Get-Counter cmdlet. And with the help of do-while loop, the data is written 10 times with every execution of
the script. It means that the execution of the script takes 100+ seconds.
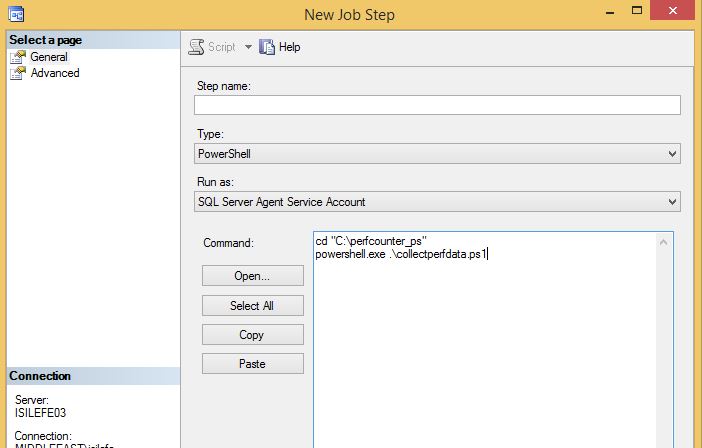
cd "C:\perfcounter_ps"<br>powershell.exe .\collectperfdata.ps1
And here is our last step, scheduling a SQL Server agent job to run periodically, The only thing you
should take into consideration is just changing the type as Powershell. After this point, you can just send
queries filtering according to counter or timestamp, even you can visualize your data on Reporting Services.
BE CAREFUL that i am using SQL Server 2012, and it is enough when I import sql powershell module
once to be able to use SQL cmdlets like Invoke-SQLcmd. In fact, SQL Module is coming with sql
server installation and the only thing you should do is running Import-Module -Name sqlps command.
However, if you are using a lower version of SQL Server, since there is not a sql module you should be
importing sql assemblies at the beginning of our powershell script.