MS Open Tech Contributes Support for Windows ETW and Perf Counters to Node.js
Here’s the latest about Node.js on Windows. Last week, working closely with the Node.js core team, we checked into the open source Node.js master branch the code to add support for ETW and Performance Counters on Windows. These new features will be included in the new V0.10 when it is released. You can download the source code now and build Node.js on your machine if you want to try out the new functionality right away.
Developers need advanced debugging and performance monitoring tools. After working to assure that Node.js can run on Windows, our focus has been to provide instrumentation features that developers can use to monitor the execution of Node applications on Windows. For Windows developers this means having the ability to collect Event Tracing for Windows ® (ETW) data and use Performance Counters to monitor application behavior at runtime. ETW is a general-purpose, high-speed tracing facility provided by the Windows operating system. To learn more about ETW, see the MSDN article Improve Debugging And Performance Tuning With ETW.
ETW
With ETW, Node developers can monitor the execution of node applications and collect data on key metrics to investigate and performance and other issues. One typical scenario for ETW is profiling the execution of the application to determine which functions are most expensive (i.e. the functions where the application spends the most time). Those functions are the ones developers should focus on in order to improve the overall performance of the application.
In Node.js we added the following ETW events, representing some of the most interesting metrics to determine the health of the application while it is running in production:
- NODE_HTTP_SERVER_REQUEST: node.js received a new HTTP Request
- NODE_HTTP_SERVER_RESPONSE: node.js responded to an HTTP Request
- NODE_HTTP_CLIENT_REQUEST: node.js made an HTTP request to a remote server
- NODE_HTTP_CLIENT_RESPONSE: node.js received the response from an HTTP Request it made
- NODE_NET_SERVER_CONNECTION: TCP socket open
- NODE_NET_STREAM_END: TCP Socket close
- NODE_GC_START: V8 starts a new GC
- NODE_GC_DONE: V8 finished a GC
For Node.js ETW events we also added some additional information about the JavaScript track trace at the time the ETW event was generated. This is important information that the developer can use to determine what code has been executed when the event was generated.
Flamegraphs
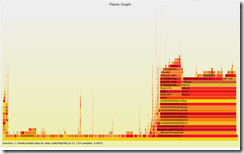
Most Node developers are familiar with Flamegraphs, which are a simple graphical representation of where time is spent during application execution. The following is an example of a Flamegraph generated using ETW.
For Windows developers we built the ETWFlamegrapth tool (based on Node.js) that can parse etl files, the log files that Windows generates when ETW events are collected. The tool can convert the etl file to a format that can be used with the Flamegraph tool that Brendan Gregg created.
To generate a Flamegraph using Brendan’s tool, you need to follow the simple instructions listed in the ETWFlamegraph project page on Github. Most of the steps involve processing the ETW files so that symbols and other information are aggregated into a single file that can be used with the Flamegraph tool.
ETW relies on a set of tools that are not installed by default. You’ll either need to install Visual Studio (for instance, Visual Studio 2012 installs the ETW tools by default) or you need to install the latest version of the Windows SDK tools. For Windows 7 the SDK can be found here.
To capture stack traces:
- xperf -on Latency -stackwalk profile
- <run the scenario you want to profile, ex node.exe myapp.js>
- xperf -d perf.etl
- SET _NT_SYMBOL_PATH=srv*C:\symbols*http://msdl.microsoft.com/downloads/symbols
- xperf -i perf.etl -o perf.csv -symbols
To extract the stack for process node.exe and fold the stacks into perf.csv.fold, this includes all information about function names that will be shown in the Framegraph.
node etlfold.js perf.csv node.exe. (etlfold.js is the file found in the ETWFlamegraph project on GitHub).
Then run the flamegraph script (requires perl) to generate the svg output:
flamegraph.pl perf.csv.fold > perf.svg
If the Node ETW events for JavaScript symbols are available then the procedure becomes the following.
- xperf -start symbols -on NodeJS-ETW-provider -f symbols.etl -BufferSize 128
- xperf -on Latency -stackwalk profile
- run the scenario you want to profile.
- xperf -d perf.etl
- xperf -stop symbols
- SET _NT_SYMBOL_PATH=srv*C:\symbols*http://msdl.microsoft.com/downloads/symbols
- xperf -merge perf.etl symbols.etl perfsym.etl
- xperf -i perfsym.etl -o perf.csv -symbols
The remaining steps are the same as in the previous example.
Note: for more advanced scenarios where you may want to have stack traces that include the Node.js core code executed at the time the event is generated, you need to include node.pdb (the debugging information file) in the symbol path so the ETW tools can resolve and include them in the Framegraph.
PerfCounters
In addition to ETW, we also added Performance Counters (PerfCounters). Like ETW, Performance counters can be used to monitor critical metrics at runtime, the main differences being that they provide aggregated data and Windows provides a great tool to display them. The easiest way to work with PerfCounters is to use the Performance monitor console but PerfCounters are also used by System Center and other data center management applications. With PerfCounters a Node application can be monitored by those management applications, which are widely used for instrumentation of large cloud and enterprise-based applications.
In Node.js we added the following performance counters, which mimic very closely the ETW events:
- HTTP server requests: number of incoming HTTP requests
- HTTP server responses: number of responses
- HTTP client requests: number of HTTP requests generated by node to a remote destination
- HTTP client responses: number of HTTP responses for requests generated by node
- Active server connections: number of active connections
- Network bytes sent: total bytes sent
- Network bytes received: total bytes received
- %Time in GC: % V8 time spent in GC
- Pipe bytes sent: total bytes sent over Named Pipes.
- Pipe bytes received: total bytes received over Named Pipes.
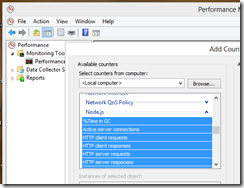
All Node.js performance counters are registered in the system so they show up in the Performance Monitor console.
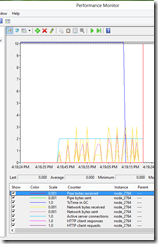
While the application is running, it’s easy to see what is happening through the Performance Monitor console:
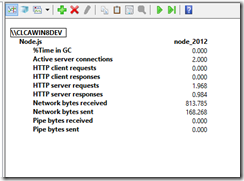
The Performance Monitor console can also display performance data in a tabular form:
Collecting live performance data at runtime is an important capability for any production environment. With these new features we have given Node.js developers the ability to use a wide range of tools that are commonly used in the Windows platform to ensure an easier transition from development to production.
More on this topic very soon, stay tuned.
Claudio Caldato
Principal Program Manager Lead
Microsoft Open Technologies, Inc.


