KYC series - basic analysis
First question Contoso wanted to know is are we making money? Is that a surprise to you? Hopefully not. But we haven't answered it yet! Primarily because though we have a strong handle on their sales side of things, but the cost data cannot be trusted. There is more business process work to do here before we can answer that question.
We did some basic analysis to get to some understanding of their business. A few plots will illustrate what we found.
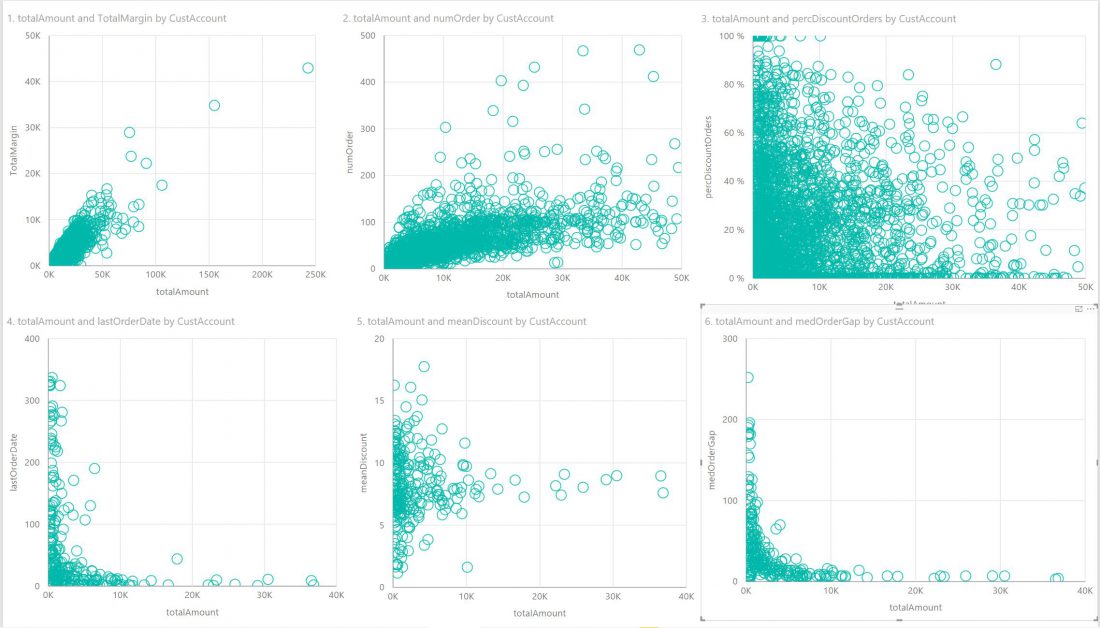
- Chart 1 – Total amount and total margin move linearly as expected, though as mentioned later there are several customers of interest who fall in negative margin territory. DIG DEEPER.
- Chart 2 – Number of orders doesn’t really have a relationship with total amount. We have customers with more than 400 orders processed with total amounts spread over a wide range from 20k to 50k. UNCELAR PICTURE.
- Chart 3 – Percentage of total orders that are discounted falls as one moves towards the right territory of large total amount. Conversely, one can see that for orders with amount less than 10k, the percent of orders discounted could be anywhere between 0 -100%. UNCLEAR.
- Chart 4 – This clearly shows that customers whose last orders came in quite a while ago do a lot less business with Contoso. Conversely, customers who do a lot of business with Contoso have placed orders quite recently. NO SURPSIES HERE
- Chart 5 – This one also clearly shows that discount percent on discounted orders has a lot of variation only when we look at marginal customers. When we look at customers who do significant business with Contoso, mean discount is quite close to zero. HEALTHY
- Chart 6 – This one also clearly shows that customers who do a lot less business with Contoso can have a lot of gap between their orders. Conversely customers who have little gap between orders are more likely to make high spend with Contoso. NO SURPRISES HERE
keep reading.