"AutoML" Parameter Search for Hierarchical Demand Forecasting Optimization
In general, machine learning approaches expose many options that affect performance and accuracy. "AutoML" (Automated ML) concerns problems of optimizing over such options. Forecasting demand of products that form a hierarchy raises this kind of challenge. We recently wrote a blog post about demand forecasting for hierarchical data. We listed several approaches to reconciling forecasts across time series data with hierarchical (or more generally grouped) structure, such as, bottom-up, middle-out, etc., so that the resulting forecasts are agreggate-consistent (lower level forecasts sum up to higher level forecasts). We also talked about the challenges of forecasting highly disaggregated time-series that contain sparse time series at the bottom level. In our approach, we opted to forecast using time-series for the middle level of the hierarchy, and obtain forecasts at lower and higher levels using disaggregation and aggregation, respectively. Depending on the chosen method and the level at which to forecast, the results of the forecast can vary dramatically, making it worthwhile to search over hierarchy levels to find the best.
In this article we describe the parameter search space for hierarchical time series (HTS) forecasting, and demonstrate how to efficiently search it using an iterative optimization approach. The approach relies on a distributed computation platform for efficient computation. We used Spark on an HDInsight cluster and Microsoft R Server as the implementation architecture of choice to distribute the iterative search over the parameter space and efficiently solve the problem.
HTS parameter search space
In general, hierarchical (or grouped) time series forecasting performance greatly varies with the algorithm parameters used and the structure of the hierarchy (or grouping structure) .
Algorithm parameters are any variation in options used in forecasting, such as time series method used to forecast individual time series within the hierarchy, method used to reconcile the forecasts across the hierarchy, weights assigned to the individual forecasts during the reconcililiation, etc. For example, one can use ARIMA or ETS for forecasting individual time series, then use bottom-up or middle-out approaches for reconciling the time series. For an extensive list of different methods and parameters available in hierarchical time series forecasting, check out the 'hts' package. It's an excellent utility and resource for understanding and forecasting hierarchical time series. For example, looking into the available parameter options in 'hts' forecasting function, one might construct a search space the following manner:
 ts_method        <- c("arima", "ets", "rw")
hts_method       <- c("bu", "comb", "tdgsa", "tdgsf", "tdfp")
comb_hts_weights <- c("sd", "none", "nseries”)
search_space     <- expand.grid(ts_method, hts_method, comb_weights, stringsAsFactors = FALSE)
Here we provide a simple R script demonstrating how to create a searchable grid of parameters for the forecasting function on a sample hierarchical data set, travesrse it, and find optimal parameters.
Structure of the hierarchy (or grouping structure) has to do with the level at which we decide to forecast, as we described above. In a more general case, when we have grouped time series, we can disaggregate the data using an arbitrary number and combination of our grouping variables. More specifically, given a set S of n grouping variables, the number of possible groupings of the data is the size of the powerset of S, that is 2^|S|. For time series data that can be disaggregated by many variables, this number can quickly become large. For example, in supply chain applications, forecast is often needed at the most granular level, that is, at the SKU level that can run into the 1000s.
Iterative optimization
If for every combination of grouping variables one attempts to forecast across all method parameter options, the search space becomes prohibitively large. Depending on the size of the hierarchy and the selected methods, forecasting at all levels of the hierarchy may take anywhere from a few seconds to several hours.
In our use-case, the option search space consists of 84 parameter settings (in addition to the method parameters listed above, we also varied the time window for which to compute historical proportions for top-down forecast disaggregation) and 255 grouping structures, which results in more than 21,000 possible combinations. In order to make the entire search space tractable, we used an iterative approach to obtain optimal parameters and grouping structure. The iterative approach is shown in the picture below.
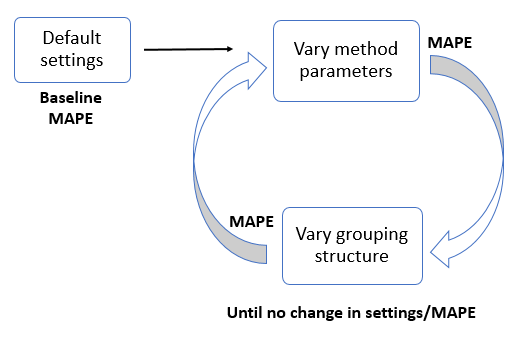
The search starts at a point in the search space with decent performance, based on experience of default parameters and a default grouping structure, from which we obtain a baseline mean absolute percent error (MAPE). We then fix the grouping structure, and search the space of parameters, to obtain "better" parameters (that minimize MAPE for that structure). We then fix those parameters, and vary the grouping structure to obtain a "better" grouping structure. We continue to iterate in this fashion until we see no change in selected parameters and the grouping structure.
As mentioned, we used MAPE to evaluate our approach, and measured its improvement from the baseline value. The validation is done using training/testing split on time series data of length L, where we train the model on L-h months and test it on the last h months.
Architecture
In order to distribute the computation, we used an HDInsight cluster, specifically, a Spark cluster with R Server (with 4 nodes, 32 cores). Once we provisioned a cluster, it was simple to distribute the computation on Spark using Microsoft R Server, and in particular, its rxExec() function.
If we wrap our forecasting code in a function (e.g. run_hierarchical_forecast) with method parameters and grouping structure as input arguments, then we can map the search space specified in the input arguments to distribute the computation over the distributed system, using the following piece of code:
 # Sets computing context to Spark
rxSetComputeContext(RxSpark())

rxResult <- rxExec(run_hierarchical_forecast,
                   rxElemArg(search_space),
                   … )
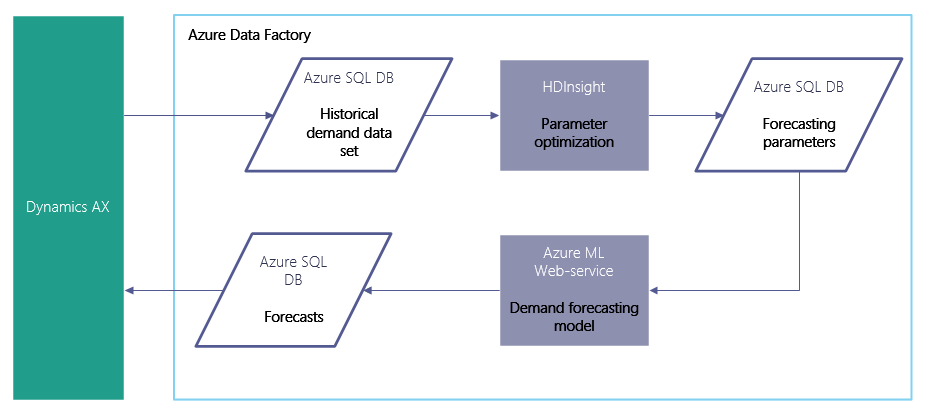
Now each time we run our demand forecasting application (described in our previous post), we can improve it by running an AutoML parameter optimization, as shown in the following picture.
Results
We ran parameter optimization on a customer demand data set with an extensive grouping structure. We started by using default settings that resulted in baseline MAPE of 9.1%. These parameter settings and the grouping structure were selected based on customer preferences as well as the preliminary evaluation of forecasting performance that showed success against the customer's existing forecasting system. After we ran our iterative optimization, we obtained optimal parameters and an optimal grouping structure that resulted in MAPE of 6.8% (due to confidentiality of the data, we cannot show the raw results). The reduced error from 9.1% to 6.8% in our use case translates into measurable business value resulting from improved monthly demand forecasts.
The total execution time took about one day (for an even faster performance, one could provision a cluster with more nodes, but for our use case it was not necessary). We estimated that if we ran the optimization on a single node, it would take about month and a half (based on the number of inividual runs and an average execution time of 144 minutes). The improvement by using Microsoft R Server to distribute the R code on the HDInsight cluster called for just the addition of a few lines of code shown above. (Setting the compute context and running rxExec() function).
For a simpler demonstration on searching a parameter space using 'hts' package and Microsoft R Server on a small public data set, please go to our sample script.
References
- Package 'hts'
- Forecasting: principles and practice - Chapter 9.4 Forecasting hierarchical or grouped time series
- Sample R Script
- HDInsight
- Microsoft R Server
Author: Vanja Paunić, Data Scientist, Microsoft