Debugging Internet Explorer - A Beginner’s Guide
As a Program Manager on the IE team, I spent comparatively little time running Internet Explorer under the debugger. In contrast, the IE developers were far more adept at solving problems with advanced debugging techniques. Nevertheless, over the years I picked up a few tricks that proved useful from time-to-time. In this post, I outline some of the simpler ways to use WinDbg to get useful information about failures in IE.
When your webpage’s scripts fail, your first step should be to hit F12 and go to the Script Debugging tab to see what went wrong. However, if IE itself crashes or hangs, the F12 Developer Tools probably can’t help you—you’ll need a native debugger. Native debuggers can be quite a bit more complicated to use than IE’s script debugger; even if you have IE’s source code, native code debugging is simply more complicated than script debugging. Also, unlike with a script bug, you’re unlikely to be able to fix IE itself (unless you find that the crash is due to a buggy browser extension, in which case you could update it or uninstall it).
Debugging Internet Explorer can be somewhat more complicated than other programs because:
- There are multiple processes involved. Typically, there’s at least one Frame/Manager process (which hosts the tabs and main window) and one or more Tab/Content processes (which host the HTML and script). This split is called Loosely-Coupled IE.
- Internet Explorer is available in both 32bit and 64bit versions. In modern IE versions, the Frame process is 64bit and the Tab processes will be either 32bit or 64bit depending on the configuration.
However, don’t despair—with the tips below, you can explore Internet Explorer under the debugger.
Install WinDbg
First, download the Debugging Tools for Windows. You’ll probably want to install the 64bit version as well as the 64bit version, unless you happen to be debugging on a 32bit version of Windows in which case you can simply install the 32bit version. Typically, I install the 64bit version to C:\dbg64\ and the 32bit version to c:\dbg32\
Configure the Post-Mortem Debugger
You can configure Windows to launch WinDbg whenever a process crashes by setting it as the post-mortem debugger.
- From an elevated 64bit instance of c:\windows\system32\cmd.exe, run c:\dbg64\WinDbg.exe -I to configure WinDbg as the default post-mortem debugger for 64bit process crashes.
- Then, from an elevated 32-bit instance of c:\windows\syswow64\cmd.exe, run c:\dbg32\WinDbg.exe –I to set the post-mortem debugger for 32bit processes.
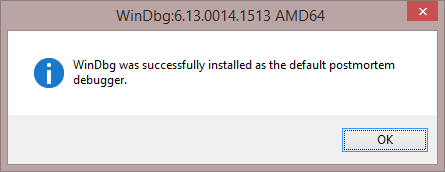
Note that the -I parameter must be in uppercase. When the command succeeds, WinDbg will show the following notice:

Manually Attaching
Of course, you may want to attach the debugger to an existing or new browser instance that hasn’t crashed. To attach to an existing instance, launch WinDbg and click File > Attach to a Process and select the iexplore.exe instance of interest.
Alternatively, you can start a new instance to debug by clicking File > Open Executable and selecting C:\Program Files\Internet Explorer\iexplore.exe. Be sure to check the Debug child processes also box at the bottom of the Open Executable screen, so that you attach to both the Frame/Manager process and the Tab/Content processes.
Tip: To simplify things, before attaching, close all browser instances that are not being debugged.
Symbols
Debuggers aren’t much fun if they don’t have the “symbol” information which maps binary offsets back to functions. Unfortunately, you aren’t likely to have access to the “private symbols” available to the IE development team, but you can configure WinDbg to automatically download and cache the “public symbols” as follows:
32bit debugger
.sympath SRV*C:\dbg32\symbols*https://msdl.microsoft.com/download/symbols; .reload
64bit debugger
.sympath SRV*C:\dbg64\symbols*https://msdl.microsoft.com/download/symbols; .reload
Next Steps
When using the 64bit debugger to debug a 32bit process, you’ll find that all of the stacks are “mangled” with wow64 virtualization function calls. To fix them, first execute:
.load wow64exts
then
.effmach x86
After using these commands, WinDbg will helpfully show you the 32-bit process’ information without the virtualization goo.
There are a huge number of commands you can use once you’re in the debugger, but here are a few of the most useful:
!analyze -v
Performs analysis of an exception (e.g. to attempt to determine the origin and nature of a pending access violation crash).
!analyze -hang
Performs analysis of an hang.
!runaway
Shows you the amount of time each thread has spent on the CPU.
g
Resumes execution of all threads when stopped at a breakpoint.
~0kp
Shows the stack trace and parameters to the functions on the stack for the thread number specified.
~*kp
Shows the stack trace and parameters to the functions on the stack for all threads. This command can be very helpful if, for instance, you’ve broken into Internet Explorer while a dialog box is showing and you want to understand what led to that dialog box being shown.
.dump /ma C:\tmp\out.dmp
Creates a dump file that can be used to diagnose a failure later, or from a different machine. Sharing a dump file with a developer is a great way to help them quickly find the source of a problem.
lm vm partialfilename*
Shows verbose information about the modules matching the specified search pattern.
bu module!function
Creates a breakpoint for the target function; the debugger will break on each hit to that function.
.foreach(pid {|}){.if($spat("${pid}","[0-9]")|$spat("${pid}","[0-9][0-9]")){|${pid}s;bu mshtml!fnName}}
Runs the specified command (in this case bu mshtml!fnName) in each process under debugging, not just the active one. This admittedly verbose syntax is useful when you would like to break whenever a specified function is hit by any process (Frame or Tab) currently loaded.
Enhancing Failures with gFlags
In some cases, you’ll find that crashes seem to occur randomly, inconsistently, or far from the code being exercised. In such cases, the problem is often that heap corruption has occurred. The failing code corrupts memory used in other codepaths, which (potentially much later in execution) crash when the trashed data is accessed.
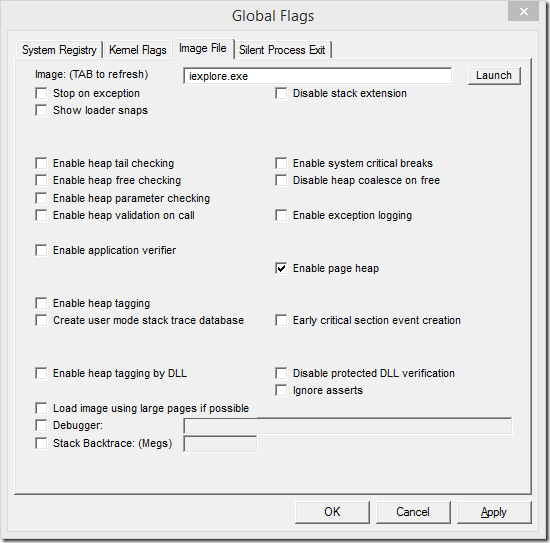
To help debug heap corruption issues, you can enable page heap for the target process. Page heap tags each heap request with additional metadata such that corruption is more likely to be discovered immediately—the process will halt with an exception at the point of the corruption.
To enable page heap, use the gflags.exe tool that is included with the WinDbg installation.

Page heap has relatively little overhead in most situations, but scenarios which result in many small allocations can be impacted, so you’ll generally want this flag set only when debugging.
Other tools
If you’re trying to understand how IE interacts with the system, there are several powerful and useful tools to try:
- Process Explorer – Shows all processes on the system, as well as what files and handles they own.
- Process Monitor – Shows all registry and filesystem reads and writes. If you configure this tool using its Options > Configure Symbols menu (point to the symbol path you set up above), it can show the stack trace at the point of each call.
- API Monitor – Shows all API calls made by the process.
If you’re trying to see how IE interacts with the Network, the F12 Developer Tools’ tab offers a basic view, and you can use Fiddler to take a deeper look.
Learning more…
Recently, Microsoft’s Tarik Soulamiwrote a great end-to-end guide to debugging on Windows; you can get Inside Windows Debugging from Amazon or local bookstores.Highly recommended.
-Eric Lawrence