What's new in F12 with Windows 8.1 Update
We are excited to announce a set of substantial updates to the developer tools in IE, (F12) as well as in Visual Studio 2013 Update 2. The updates in F12 accompany the new releases in IE11.
Previously, we described the capabilities of F12, and its focus on a fast, iterative workflow, on providing accurate data in the DOM Explorer and on providing actionable data in the memory and performance tools.
As you use F12 with this update, you will notice enhancements for the following:
- A tighter, iterative workflow with change tracking in the CSS tools
- An ability to debug in the code you wrote such as CoffeeScript or TypeScript, with sourcemaps support, and debug “just-my-code,” if you are using libraries from other developers
- Enhancements that get you to solutions faster, for example when finding memory leaks, with the enhanced JS snapshot tools and filtering improvements.
Let’s take a look at these improvements to the F12 tools.
Tracking Changes you make in CSS with Change-bars
One of the great strengths of tools like F12 is they allow you to edit the look of any Web site directly within the browser, without you requiring our source code. However, if you spend time making edits it is difficult to keep track of all the changes you make across your CSS and then applying those final edits back to you origin sources. To improve this situation we have introduced an ability to record and track changes, both visually with ‘change-bars’, as well as through a new ‘Changes’ CSS panel in the in the DOM Explorer.
Any change you make in the Styles pane in the DOM Explorer to CSS rules and properties will have a visual clue in the left-margin next to the property or rule that you edited. These are the ‘change-bars’, and they show green for new properties, yellow for changed properties and values and red for deleted properties. These change-bars will be retained, even if you begin to look at other DOM nodes.
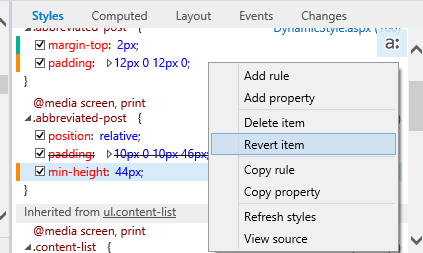
Changebars on the Styles tab
As you may make multiple edits across many nodes, we added a new tab in the CSS panel that lists all the changes in the current F12 session, as a ‘diff’ view so that you can use it as a checklist when you make manual edits to your source code. It also supports the ability to copy and revert changes through a context menu.
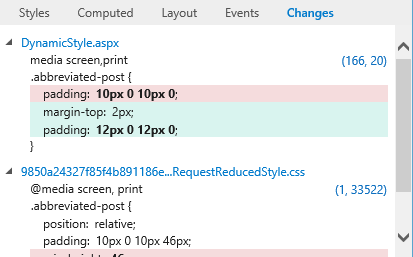
The new Changes tab
Debugging your App with “Just My Code”
If you are developing Web sites and apps, then you are likely using 3rd party libraries like jQuery or Angular, and typically these libraries are often minified. We often see developers who are debugging their code step into library code, and get buried in the depths of that library, before being able to get back to their code to debug their issue.
Visual Studio has supported a feature called “Just My Code” (JMC) managed languages for a while and with Visual Studio 2012, it is also enabled for JavaScript. The idea behind JMC is that we keep the debugger in your code, in the code you want to debug and not into code you can’t really change.
With this feature now in F12, there are two key things you will see when you debug
- You will never ‘step into’ a file (library) that is marked as library code. You can mark a library through the file picker in the debugger (see below), even if you have stepped into the file. Once marked, any step operation will take you to your code.
- If you enable “break on all exceptions” you will never break on an exception thrown and handled in library code.
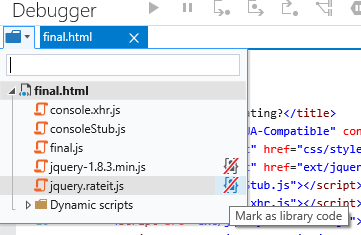
Marking files as library code
By default F12 will recognize files that match the URL *.min.js as library code. You can modify this behavior easily however, by marking libraries in the debugger’s file picker or in the context menu of the file tab if you have the file open in the debugger.
We will show much more about this feature and the workflow in a follow-on blog post.
Debugging your App written with other Languages using Source Maps (v3)
As JavaScript apps have become more and more complex recently there’s an increasing trend to author in another language that compiles to JavaScript (the F12 tools are written in TypeScript and compiled to JavaScript for example). Similarly, you may have minified JavaScript code that is not the origin source that you wrote the app in. This compilation process means the JavaScript that executes in the browser and that you debug, isn’t the code you have in your editor, which makes debugging more challenging.
To solve this problem, there’s a community-driven format that has gained a lot of traction with browsers and Visual Studio, that maps origin source and compiled files called “Source Maps” (spec). These maps are generated during compilation and with this release of F12 we’ve added support for v3 of the Source Map spec.
When a compiled JavaScript file defines a valid source map, F12 will default to load the original source file, rather than the running JS file, when ‘source maps’ are turned on (a button on the debugger). You will have the following capabilities:
- Files in the file picker use their origin source name, rather than the running documents.
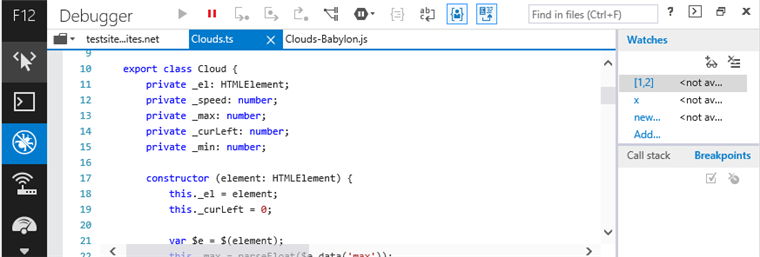
- The file(s) you open in the debugger, and use to step through your code are your origin source files, and for TypeScript, CoffeeScript and Script # these files will be colorized appropriately (as you can see with the TypeScript file below).
As with Just-My-Code, we will go into more depth on source maps in a follow-on blog post.
Three way snapshots
When debugging a memory leak, you typically will be presented with a large amount of data, even if filtered) that memory profilers create, which makes finding that leak complicated. In F12 we had previously taken steps for the tools to summarize the state of the app in the snapshot tiles, and opportunistically suggest potential issues with the detached DOM information indicators. However, in this update, we wanted to take this further, by helping developers zero-down on issues even easier.
The F12 Memory tool now includes the ability to compare three snapshots (and get a scoping view of those snapshots), that is a cleaner process to determine a leak. The snapshots are:
- The initial state of your app before you start the scenario that provides the baseline for objects in your app.
- Once your scenario is completed, which may augment the possible baseline for your app, which then requires a further snapshot once you execute the scenario again.
- The ‘back to normal’ state of your application, once you try the scenario again. In this state all of the objects from your scenario should have been freed (or you expect them to be alive).
With these snapshots you can compare them and use the new “Scope” filter dropdown to select the “objects left over from snapshot #2,” which represents your scenario end state and potentially a set of objects that shouldn’t be around anymore, as shown below.
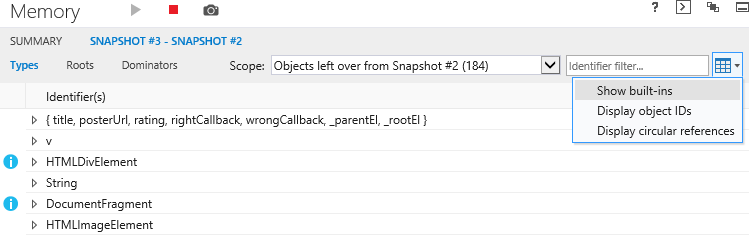
Scope filter
The types view that you see above, shows the list of objects and a gutter indicator of where potential issues may reside.
Tooling for IE on Windows Phone in Visual Studio 2013 Update 2
If you have spent time trying to make a compelling mobile version of your Web site you have likely hit issues with it not looking or working correctly on mobile browsers. To help with this on Windows Phone, we’re excited to announce that in Visual Studio 2013 Update 2 we have enabled the use of Visual Studio’s debugging and performance tools for Internet Explorer on Windows Phone 8.1. For more details on this have a read of the Visual Studio ALM Blog on this topic.
Many other improvements…
In this release of F12 we’ve tried to address many customer requests, as well as address bugs that include several crashes caused by the network inspector and not respecting conditional comments when using F12 to emulator lower document modes. Rather than the list the bugs here the bugs will be updated on the Microsoft Connect site for IE (https://connect.microsoft.com/IE/Feedback).
Here’s a more detailed list of the changes you’ll see in this release of F12.
Shell
- Ctrl+[ and ctrl+] to navigate between tools
Console
- Dropdown to enumerate execution targets.
- Inspect objects that are logged via console.log including printf-style formatting.
- Locals (at breakpoint) in intellisense for the console.
- Console $_ shortcut to access the result of the last evaluation in the console.
- Always record console messages – before F12 launch (via Internet Options -> Advanced -> (check) Always record developer console messages).
Debugger
- Persist BPs, Watches, Tabs and the like so I don't keep losing my state.
- Debug my Typescript/compiled code inside F12 using Source Maps.
- Debug just my code and not be bothered by library code (JMC).
- Name eval code via //#sourceUrl=<url> comment.
- Keyboard shortcut to abort and refresh page when broken via ctrl+shift+f5.
- Fully qualified function names (e.g. a.b.c) in call stack and profiler views.
DOM Explorer
- CSS pseudo states - set the pseudo state for an element to test out my pseudo styles.
- CSS Changebars - see what values have changed in the styles view.
- CSS Changes View - see final applied CSS changes and copy to clipboard.
- Combined Computed Style Panel - view the CSS styles in a cohesive and CSS pane adding editing and links to source.
- Ctrl+b in DOM Explorer for select element.
Emulation
- Doc Mode Awareness - why my page is in certain doc mode in order to understand my compatibility scenarios better.
UI Responsiveness
- Sort all levels of events in the timeline details view by duration.
- Simplify the timeline details view by filtering out events within certain categories (e.g. GC, Image decoding).
- Easily zoom the graph and detail views to the duration of time for a specific event instance (via context menu).
- Identify the exact property that was changed (and the value it was changed to) when a DOM element's inline styles are programmatically modified.
Memory
- Identify the line of code that was responsible for allocating a specific function, so that I can correlate memory with source.
- Context menu item to show object in dominators view (and view retained size etc.).
- Updates to the types views to show which type(s) accounted for the majority growth in a diff, so that you can rationalize object churn more easily.
- Gridlines on table UI.
- Settings UI (show built ins, circular refs, object ids).
Summary
With this update to IE11 and F12, we’re updating developer tools more often getting you the latest features and bug fixes as soon as we can. Expect to see and hear from us more and if you’d like to provide feedback, or ask for new features and help simply reach out on twitter @IEDevChat, or through the IE11 Send Feedback tool or on Connect.
This post just scratches the surface of what’s new in F12. Over the next few weeks we’ll be publishing blog entries that go into more depth and show you how to use F12. There’s also our complete F12 developer tools documentation on MSDN.
In the meantime, we look forward to your feedback. You can reach out to the team on Twitter @IEDevChat, through the IE11 Send Feedback tool or on Connect.
— Andy Sterland, Program Manager, F12 Tools
— Jonathan Carter, Program Manager, F12 Tools
— Simon Calvert, Lead Program Manager, F12 Tools