IntelliTrace Web Requests
IntelliTrace Web Requests
Moving forward the Visual Studio team is committed to bringing new updates to Visual Studio on a much faster cadence than the usual release and service pack cycle. As part of our run up to this commitment we’ve used the Visual Studio 11 Beta period to add some new features to IntelliTrace that were not ready for the Beta release date. By downloading an update to Visual Studio 11 Beta, which should be available via an update from the VS UI this week, some powerful new IntelliTrace functionality will be added for helping to diagnose issues in production IIS web applications. This new functionality helps to capture the start and end of each web request hitting the server, collects and records information from each request, and shows which IntelliTrace events are correlated with the execution of each web request.
Collecting web request information on a server
Visual Studio 11 Beta already includes the means by which you can collect IntelliTrace web request information on a production server. However, there is no way to actually view the collected web request information with a non-updated VS11 Beta, the collected files can be opened, but no web request UI controls will be available to the user. The Beta update adds the new web requests UI and opens up the full potential of these IIS server collected IntelliTrace files.
This article is focused on how to use the new web request UI to analyze data, so the details of collecting the IntelliTrace logs are best left to our in-depth MSDN article on the topic. Note that this collection work makes use of our new standalone collection bits and PowerShell scripts, so that files can be quickly and easily collected through PowerShell while just having to copy over a few files to the server (no installation required).
Analyzing web request information
Opening an IntelliTrace file collected with web request information in Visual Studio 11 Ultimate after installing the Beta update will add a new web requests section to the IntelliTrace summary page. Expanding this web requests section will show a table like the one below. The example file below was collected on a Team Foundation Server instance that we use locally for source control.
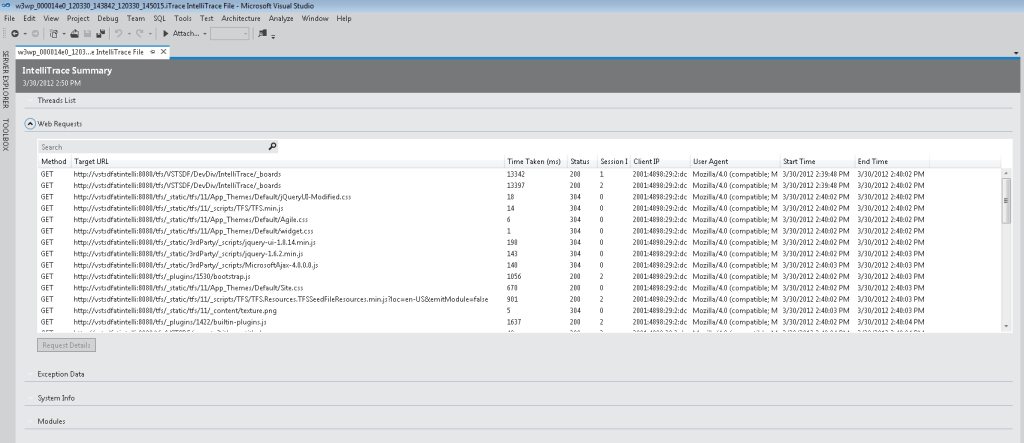
This table is a listing of all the web requests that IntelliTrace recorded while collecting data on the server. For each request to the server we capture some basic information on the request: Method, Target URL, Time Taken, Status, Session Id, Client IP, User Agent, Start Time and End Time. Most of these categories are self-explanatory with the exception of Session Id. This value for Session Id is not related to ASP.net’s concepts of SessionID but is simply an increasing integer that IntelliTrace keeps internally and increments whenever a new session is started. So by looking at just web requests that have the same Session Id value in this view you will be seeing all web request for a specific user session, but you cannot match this value against the SessionID value from ASP.net Session State. By default the web request are sorted in the order in which they hit the server.
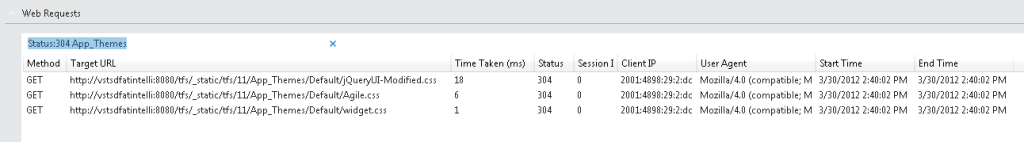
The search grid at the top of this control provides both plain text search, which searches all but the time columns, and some basic column filtering syntax. This column filtering is done by specifying the column name with no spaces, a colon, and then a filter value. You can do one of these filters per filterable column; the columns which are filterable are listed in the tooltip of the searchbox.
As an example, the following query will pull all of the web requests that returned a 304 and that contain the text “App_Themes.”
Status:304 App_Themes
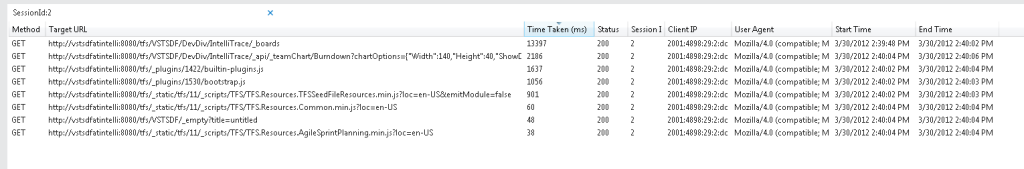
Or here are all of the web requests that hit the server for the second recorded user session:
Closer analysis on a web request
From the summary page listing you can dig deeper into a web request by double clicking it in the list or selecting it and clicking the “Request Details” button at the bottom of the list. A new window will be opened as a preview tab, if you are not familiar with them yet (as they are new in VS11) preview tabs will continue to open in the same document tab unless you promote them to the main document well. As you open details on more web requests they will close the previously opened details page unless it was promoted from out of the preview tab. Currently if you have a very large file full of web requests opening this details page can take a little bit of time, this performance is being worked on, but expect a bit of a wait for now.
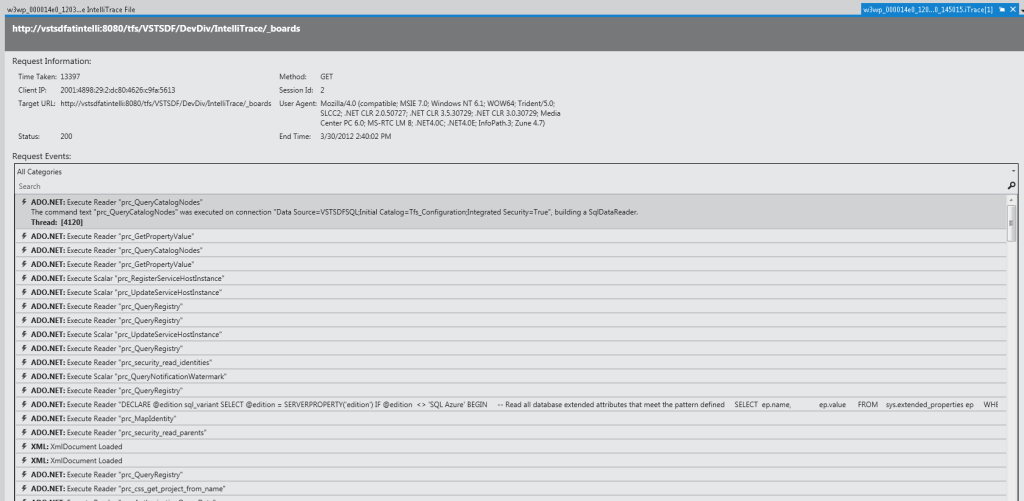
The top of the request details page has the same basic request information that were surfaced on the main summary page. Below that listing is list of IntelliTrace events that looks similar to the list that you would see while live debugging with IntelliTrace or actively debugging a recorded IntelliTrace log. This list shows all of the IntelliTrace events that were recorded while executing this specific web request on the server. They are listed in the order that they occurred with the first event starting at the top of the list.
In the example events list above you can see a bunch of ADO.net events pulling data from a database as well as a couple of possibly problematic exceptions being thrown (see below).
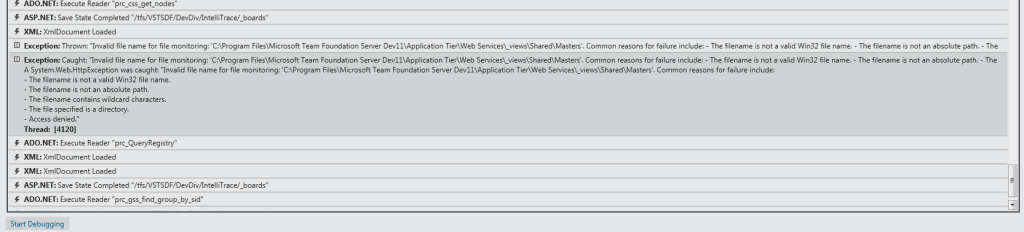
By double clicking on any of these events the debugger will start and begin debugging the IntelliTrace log at that specific event. If you have collected your log with method calls information, using the collection_plan.ASP.NET.trace.xml or by customizing your collection plan, you can then step around in code from that location and examine method parameters and return values. One important caveat to note here is that being able to view source when debugging a recorded log requires that the symbol (PDB) files for the version of your application that was running on the IIS server need to be available in the Visual Studio symbol path. Without these symbols, resolving to source locations is impossible and only the “symbols not found” window will be shown when debugging.
How it all works
After this quick little introduction to this new feature I’m next going to be digging in a bit more into how the internals of this web request feature works from the IntelliTrace side, so keep an eye out here for another blog entry soon on that topic.
Ian Huff