Case Study: Parallelism and Memory Usage, VS2010 Tools to the Rescue!
I was approached recently by a request to help a Microsoft customer improve his application’s performance. He had a managed application that exhibited a fair amount of data level parallelism in a long-running for_each loop. When that loop was parallelized using the Parallel.ForEach() construct in TPL (Task Parallel Library) on a quad core system, our customer was not happy with the resulting performance improvement. He expected linear speedup since there wasn’t much sharing and synchronization in the implementation.
Actually, what I just said was true after my friend Stephen Toub helped the customer resolve a race condition on a data structure. The solution that was used was considerably better than using a lock. It involved using a concurrent data structure also provided by TPL (a ConcurrentBag). Our customer was using the Concurrency Visualizer, but needed our help to figure out how to use it to identify the root cause of his scalability problem. So, we took a look at his trace together and within a couple of minutes, it was clear that we were dealing with a classic workstation GC overhead pattern.
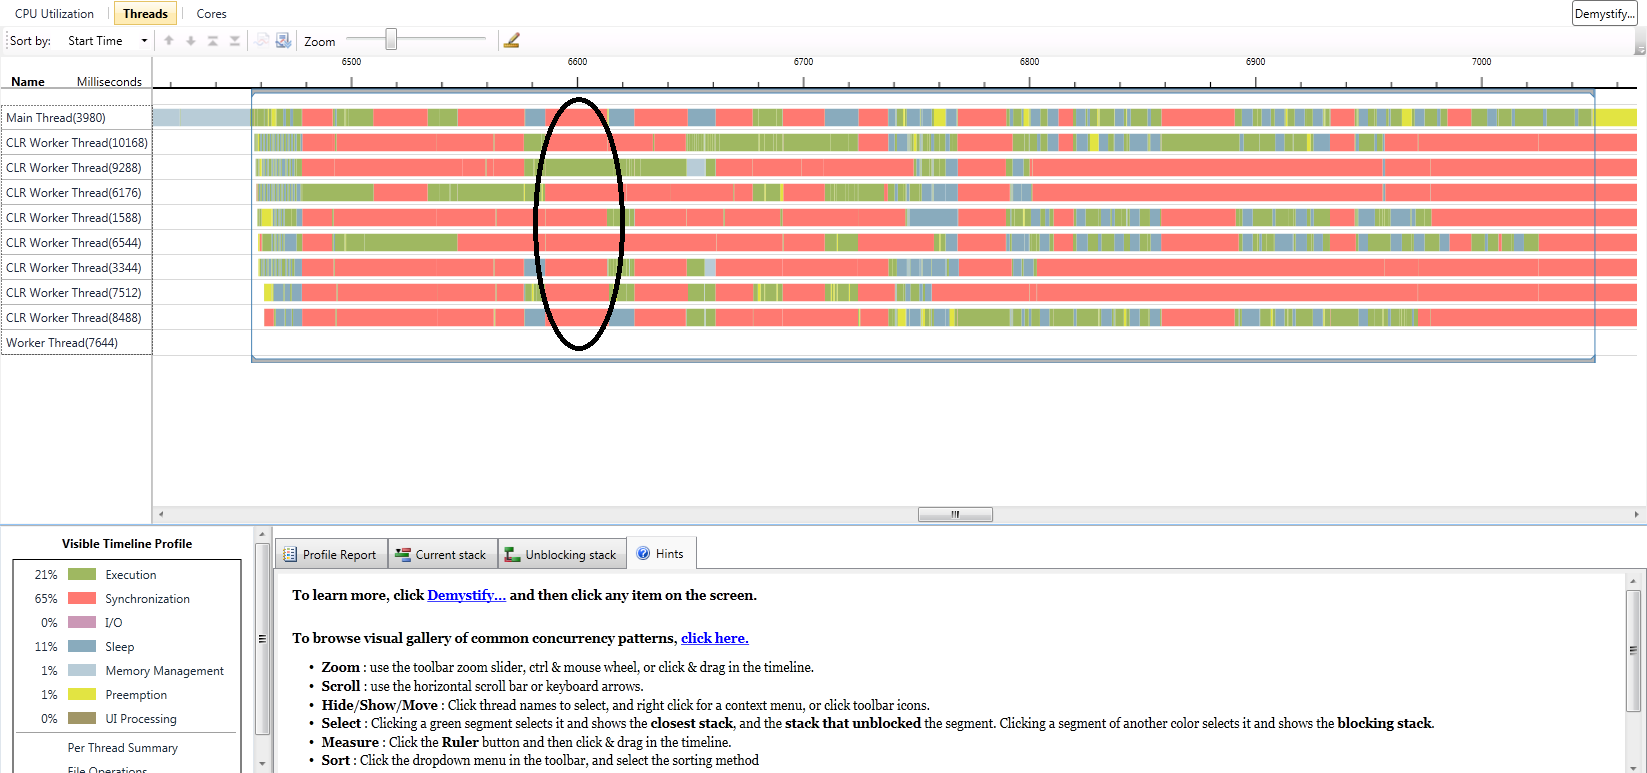
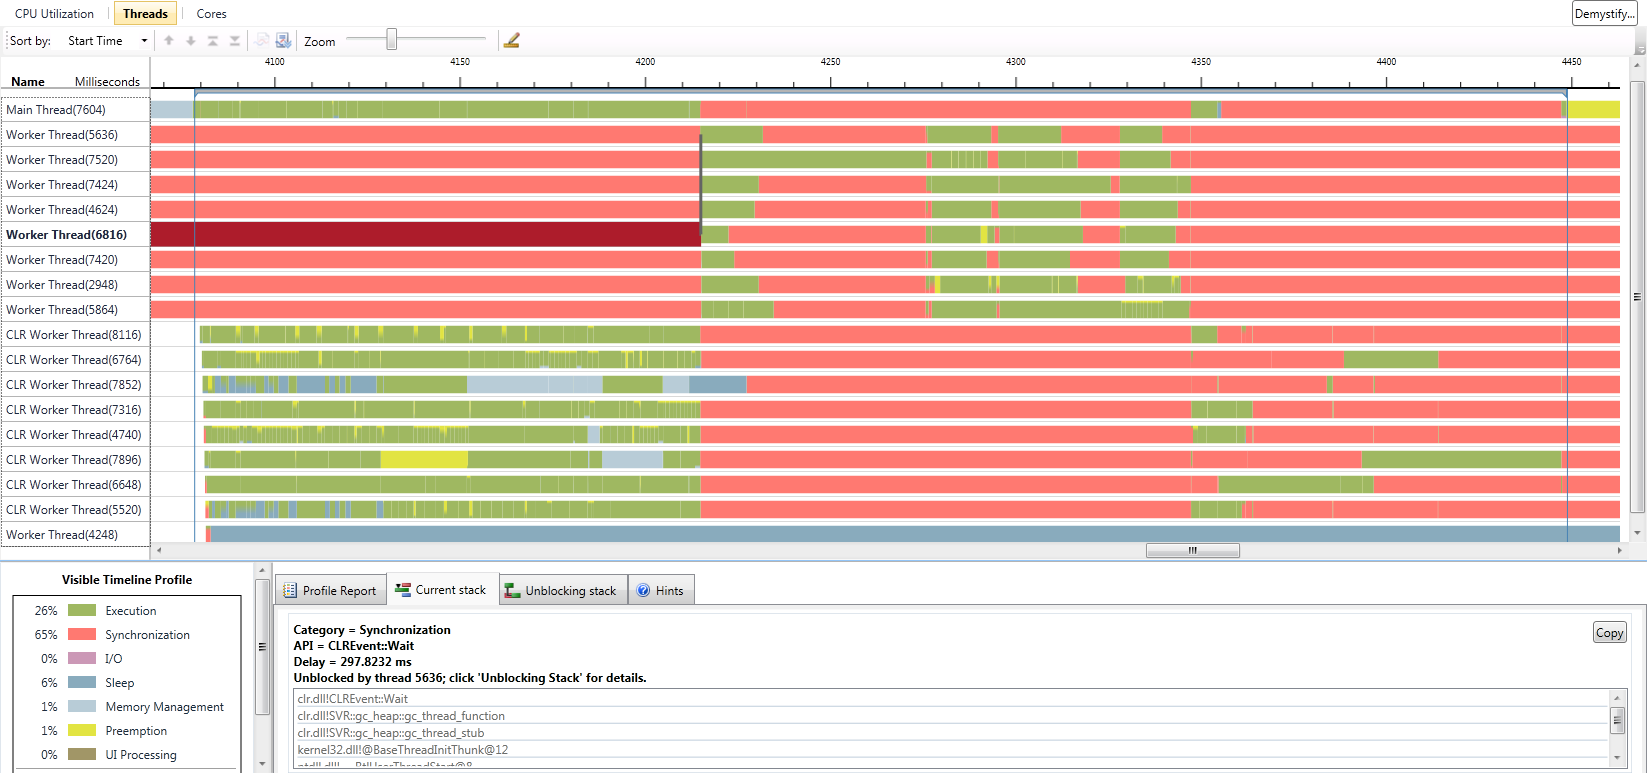
As you see in the above screenshot, when the garbage collector kicks in, all threads but one are blocked, as shown in the highlighted area above. This pattern repeats itself multiple times in the parallel loop, indicating that garbage collection occurs often. If you click on one of the red synchronization regions for the blocked threads, you will see a callstack (be sure to add the Microsoft Symbol Server to your symbols path under Tools->Options->Debugger->Symbols to get good symbols in the runtime) containing the following at the tail end (top of the callstack view):
clr.dll!CLREvent::Wait
clr.dll!WKS::gc_heap::wait_for_gc_done
clr.dll!WKS::gc_heap::try_allocate_more_space
clr.dll!WKS::gc_heap::allocate_more_space
clr.dll!WKS::GCHeap::Alloc
clr.dll!Alloc
This indicates that the thread is waiting on GC to complete. The only thread executing during the time will be running GC code (click on a green segment for a sample callstack). One option to improve the performance of GC is to use the Server GC; an implementation that creates a heap per core and does not block all threads if a GC event is triggered. This change resulted in a 40%+ improvement in performance exhibited by significantly less blocking during execution (see screenshot below showing that most of the time, many threads are executing on this quad core hyperthreaded system). But, we still needed to get to the underlying root of excessive garbage collections. In case you’re interested in how to switch to the server GC implementation in Visual Studio, here are the steps:
1. Create an application config file. This can be done by right clicking on the project file and selecting Add->New Item->General->Application Configuration File.
2. Edit the config file to add the runtime option shown below. Beware, this is case-sensitive!
<?xml version="1.0" encoding="utf-8" ?>
<configuration>
<runtime>
<gcServer enabled="true"/>
</runtime>
</configuration>
Before explaining how we solved that mystery, let’s consider an interesting reality about parallelism. If you start out with a loop that creates temporary objects, even though that’s bad if it can be avoided, the rate at which your program will create those objects is limited by the speed of that single thread. Now imagine when you increase the number of threads running that code at a given point in time. You’ve just increased the rate at which objects are created and discarded! So, excessive object creation issues get exacerbated and GC’s happen more frequently, making even more important to do a good job with memory usage. The more threads/cores thrown at the problem, the higher the rate of memory churn.

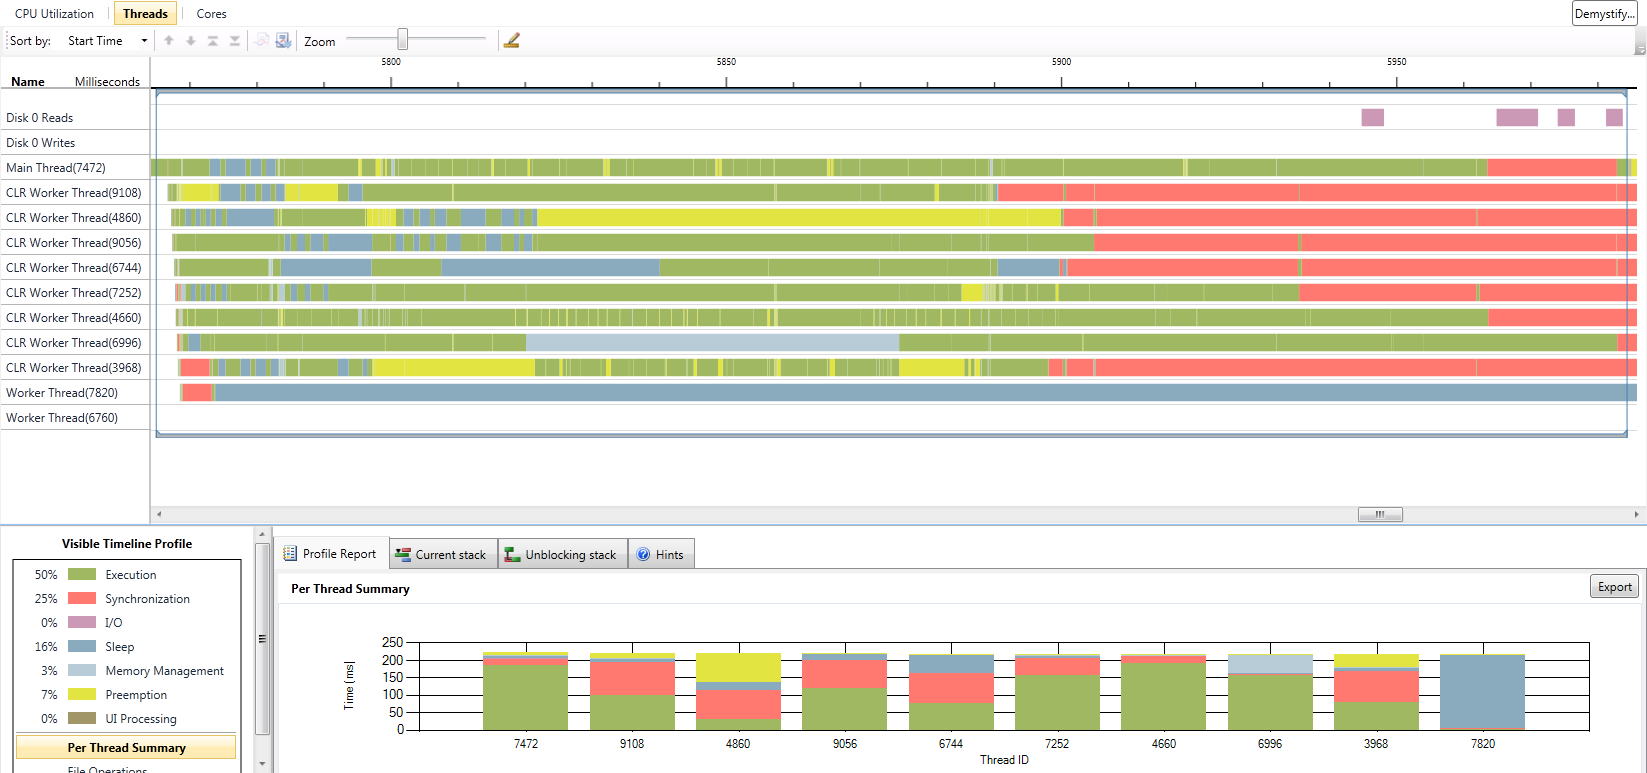
There’s a nice profiling tool in VS2010 dedicated to analyzing CLR memory usage. It’s the “.NET Memory Allocation (Sampling)” option that you see in the Performance Wizard Window. This tool samples object allocations in your application and reports many useful statistics. The most important one in our investigation was a list of most frequently allocated objects. Between that list and looking at the source code, we were able to identify an object type that we noticed was being frequently created inside the loop. It turned out that the object was a pretty simple structure containing two doubles. So, we decided that it’s worth allocating two local doubles on the stack instead of creating temporary objects. And, voila! A very happy customer sent an email back a few hours later, reporting that his test scenario that was running at 1.1 seconds was now taking .25 seconds on a quad core (hyperthreaded) system. See the screenshot of a profile of this run below.
I thought that I’d share this with you not only because it’s really cool to see a customer using our technologies successfully, but because there are some important lessons here:
1. Poor memory usage can be exacerbated by parallelism.
2. Excessive garbage collections can ruin your application’s performance.
3. For parallel applications, you might see benefit from using the Server GC.
4. The .NET Memory Allocation profiling tool can help you find the root cause of your excessive memory usage patterns.
5. The Concurrency Visualizer was very effective at exposing the problem and helping us address it.
I hope you found this helpful.
-Hazim