Performance Pattern 2: Disk I/O
A common source of performance bugs is disk I/O. In this blog, I'm going to give an overview of the features in our tool that help developers understand source of I/O stalls, including determining latency, files involved, and relating behavior to application source code.
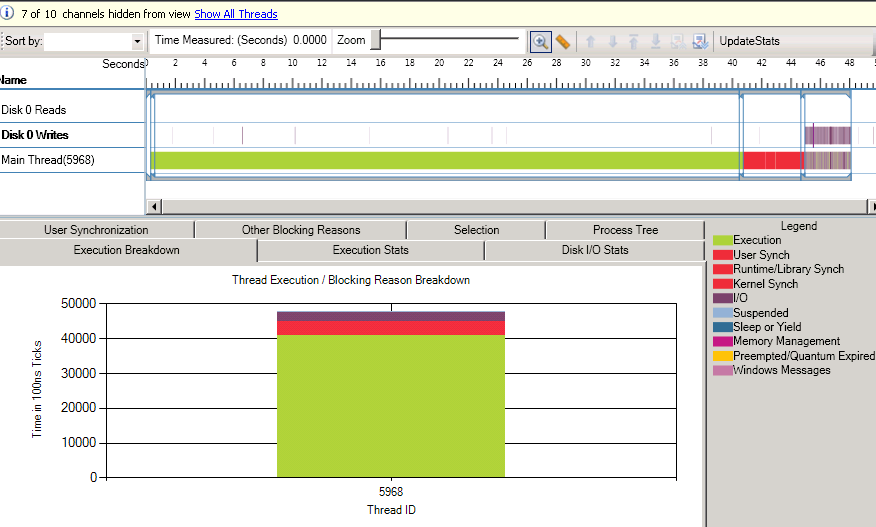
The first screenshot, shown above illustrates how I/O stalls are depicted in our application. In the Thread Blocking view, I/O delays have a dedicated category (dark purple in VSTS Beta 1). You can identify the threads that are spending a significant fraction of their lifetime blocked I/O using the Execution Breakdown tab. Using this view, you can focus your attention on the thread(s) that are relevant and you may choose to eliminate other threads from the view by selecting the thread channels on the left and then clicking the "Hide selected threads" icon in the toolbar. In the screenshot, I've hidden all but the main thread (id = 5968) from the view and you can observe from the breakdown graph that this thread spends most of its time executing, except for some synchronization and I/O delays. In the timeline, you can observe that the I/O stalls occur at the tail end of execution.
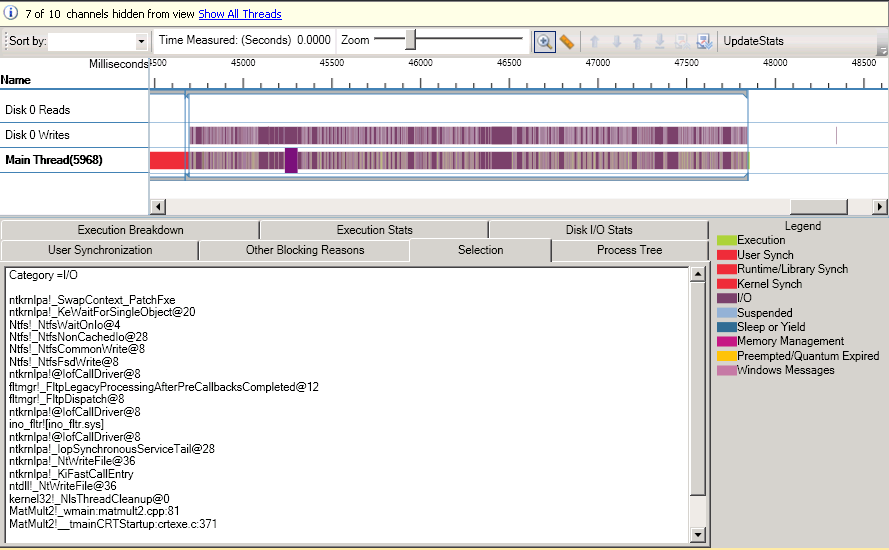
The screenshot above shows what happens when you zoom in on that phase with lots of I/O stalls. More specifically, it shows what happens when you click on one of the I/O blocking segments. You will notice that the "Selection" tab, now shows details concerning this blocking event, more specifically (if it wasn't for a bug in Beta 1), it would show something like the following text:
Category = I/O
API = WriteFile
kernel32!_WriteFile@
MatMult2!_wmain:myprogram.cpp:81
MatMult2!__tmainCRTStartup:crtexe.c:371
Delay = 70.3215 ms
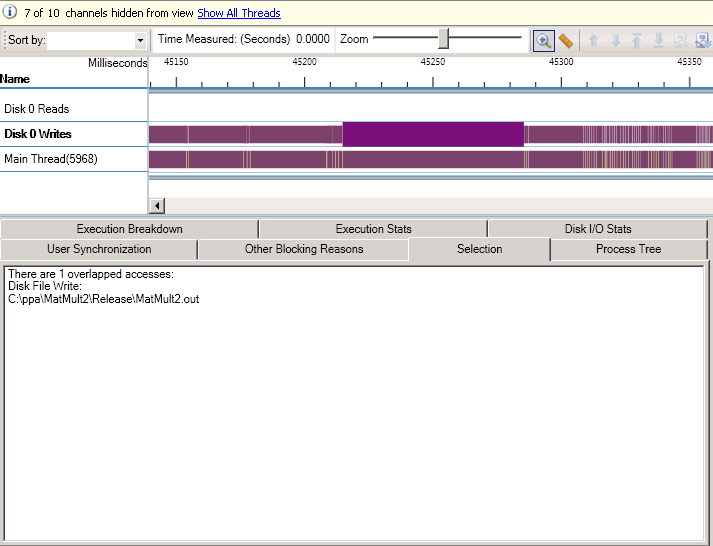
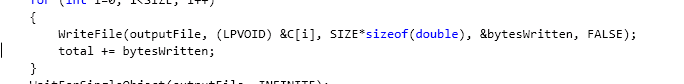
Now, what we'd like to know is the file that was being written to at this time. The way you can do this is by moving the thread to be near the Disk write channels and clicking on the write segment (if available) that closely corresponds to the I/O blocking event. I've zoomed in on the blocking event that I selected above and now you can see that what happens when I click on the Disk 0 Write channel segment right above the blocking event. The Selection tab content now shows the number of physical disk I/O writes that were occuring at that moment with a list of the filenames involved. In this case, the file is "MatMult2.out". At this point, you are most likely interested in knowing the aggregate delay incurred writing to this file and where in my application these delays manifest themselves. To do that, there are two tools. First, when you click on the "Disk I/O Stats" tab, you will get a summary of the files being read/written to in the current view as well as the number, type of access, and number of bytes, in addition to the I/O latency. Second, if you select the "Other Blocking Reasons" tab, you will get a summary of blocking delays, collated by callstack so you can identify the number of blocking events on the specific WriteFile call in the current view. You should make sure to click the "UpdateStats" button in the toolbar to make sure that the reports are updated for the current view and threads selected. This reporting capability will be improved to filter on specific blocking categories in the future. From this report, you can also right-click on a callstack frame (e.g., WriteFile), which would allow you to view either the function body or the callsites for the current function. The next screenshot shows how the source file where the call to WriteFile is made opens up in this case with the cursor in the general vicinity of the call.
A couple of quick notes are in order about I/O and interactions with the operating system in our tool:
- We show "physical" disk I/O in our tool, so disk I/O that is buffered will not show up. We made the decision because physical I/O is more important from a performance perspective if it is synchronous. This brings up an interesting topic of system buffer caches that are used to hide latency. If you run an app that reads a file twice in a row and profile it each time, it is not uncommon to see many I/O blocking events reading the file in the first run, but not the second. You should keep such interactions with the operating system in mind when doing performance analysis.
- Sometime, I/O that is initiated by the application cannot be attributed directly back to it. This can of I/O is often attributed to the system process. We therefore show all physical disk I/O initiated both by your application and the system process. You should keep this in mind when you are analyzing results because there might be I/O from other processes in the system. Although this can be "noise" from a user's perspective, it can also help understand some system-level physical disk contention in your system.
- The Disk I/O Stats view as well as callstack reports are going to be significantly enhanced in Beta 2 to improve I/O investigations.
- Application startup performance is often limited by DLL load times. Our tool can be a great aid in analyzing such scenarios. DLL loads, although they require I/O, can be manifested as "memory management" in our tool due to paging activity. You should be aware of this. I will likely write a dedicated performance pattern article on this in the near future.
Now go play with our tool!