VS2010: How to use the Parallel Performance Analysis Tools
This is a second post in the series about the parallel performance tools that my team is shipping in VS2010. In the previous post, I gave a quick overview of the features of our tools. In this post, I will demonstrate how you can start analyzing your multithreaded application's performance using the VS2010 Beta 1 release as a guide.
For the purposes of this tutorial, I'll assume that you have a solution of interest loaded and built in VS. Although that is not strictly needed to use our tool, we'll concentrate on this scenario for now. When you're ready to analyze your application, you should open the Analyze menu (if you can't find it, you're probably not using the VS Team System Beta 1, so see my previous post for a link).
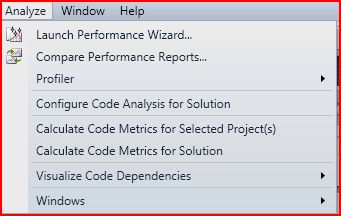
Choose the "Launch Performance Wizard" option, which will present you with the following:
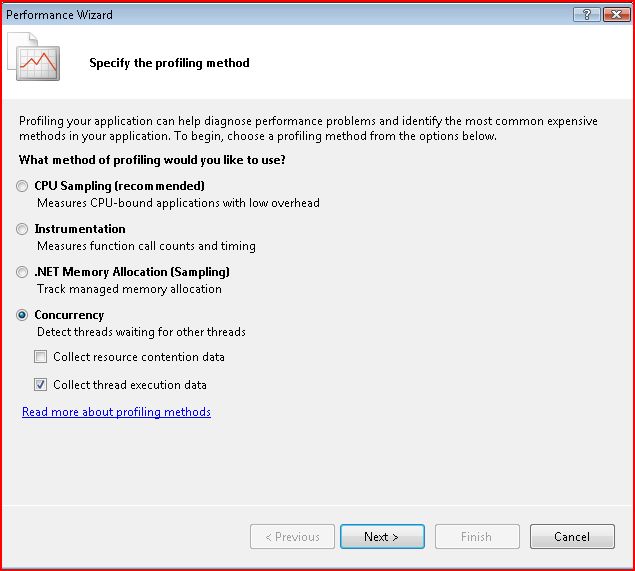
Select the "Concurrency" profiling method and select the second check box for our tool. The "resource contention" option is another cool tool that you should use, but for this series, we'll assume that the first option is turned off. Click "Next" and you'll be presented with a dialog to choose your application. In this case, my current solution shows up by default:
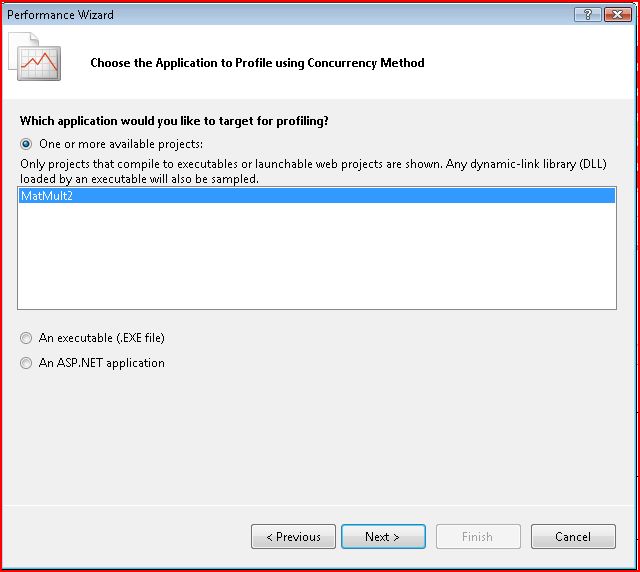
Since this is fine for my purposes, I just click "Next". Now, I'm presented with an option to launch the profiler at the end of the performance wizard. For this walkthrough, I'll assume that you chose the default, which is to launch the profiler:
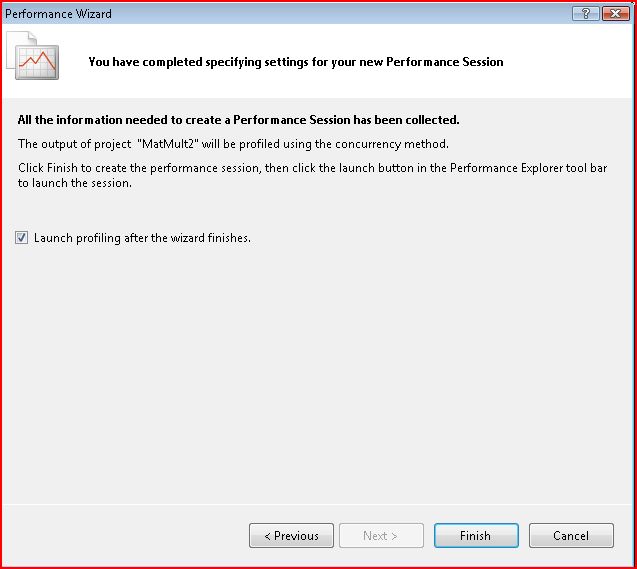
Click "Finish" and the profiler will launch your application and collect data. This should also bring up the "Performance Explorer" window in Visual Studio:
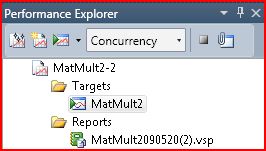
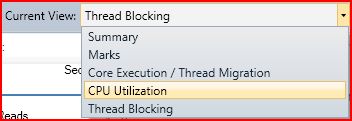
The performance wizard has created a "Performance Session" named "MatMult2-2" in this case, the default profiling method "Concurrency" is shown in the pull-down menu, my solution's executable is listed under the "Targets" folder, and a "Reports" folder is shown. There are multiple buttons on the explorer's toolbar. From left to right, these buttons are used to launch the Performance Wizard, create a new Performance Session, run a profiling session (using launch), stop profiler data collection, and then attach/detach if you'd like to profile a running application. In our walkthrough, collection will stop if you click the stop button (in the performance explorer window's toolbar) or when the process terminates (whether normally or by user action). Once data collection completes, the profiler will generate a profiling report with a .vsp extension and add it to the reports folder of the associated performance session. By default, the profiler will immediately open the profile report after collection completes. To access the views described in my previous post, you can choose the appropriate view from the "Current View" pulldown menu in the profile report toolbar:
Next, I will post some usage examples to illustrate how you may use our tool to understand and fix performance issues.
Enjoy!